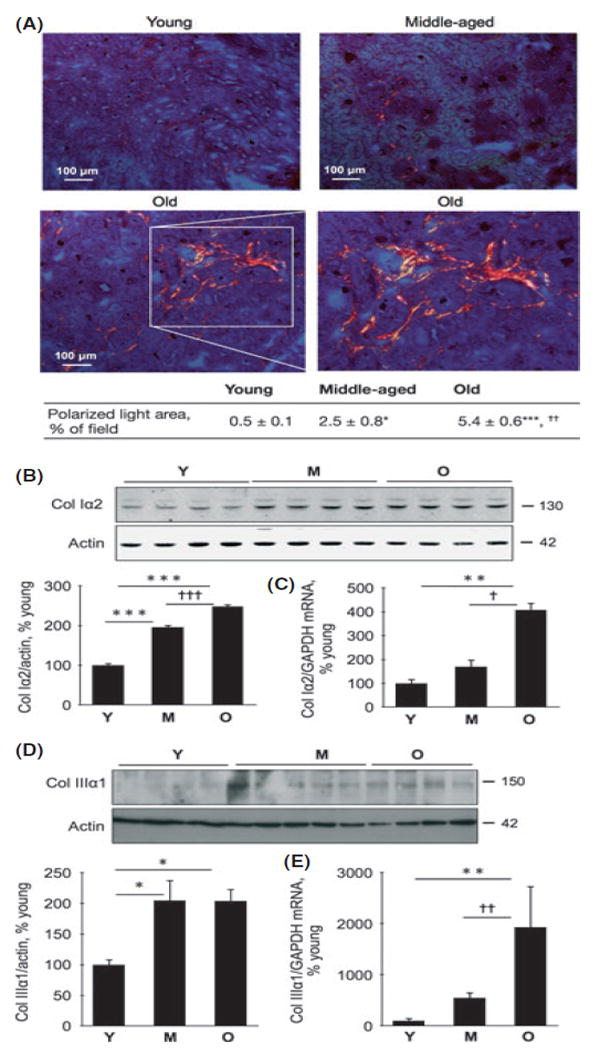
Fig 3.

Expression of collagen types I and III in renal parenchyma in young (Y), middle-aged (M), and old (O) mice. (A) Kidney sections were stained with Sirius Red and examined under polarized light to detect cross-linked type I and type III collagens. The boxed area in the bottom left panel is enlarged in the bottom right panel to show anatomical details of the stained area. Composite mean ± SE data from 3 to 4 mice in each group are shown in a table (*P < 0.05, ***P < 0.001 vs. young mice; ††<0.01 vs. middle-aged mice by ANOVA). (B, D) Equal amounts of renal cortical homogenates from mice were separated by SDS-PAGE and immunoblotted with a specific antibody against either collagen type Iα2 chain or collagen type IIIα1 chain. Composite mean ± SE data from 4 to 5 mice in each group are shown in a histogram (*P < 0.05, ***P < 0.001 vs. young mice; †††<0.001 vs. middle-aged mice by ANOVA). (C) Quantitative RT–PCR was performed to assess changes in mRNA for collagen types Iα2 chain; **P < 0.01 vs. young mice, †P < 0.05 vs. middle-aged mice (n = 10 mice in each group). (E) Quantitative RT-PCR for type IIIα1 chain mRNA (**P < 0.01 vs. young, ††P < 0.01 vs. middle-aged mice by ANOVA, n = 5-9 mice in each group).
