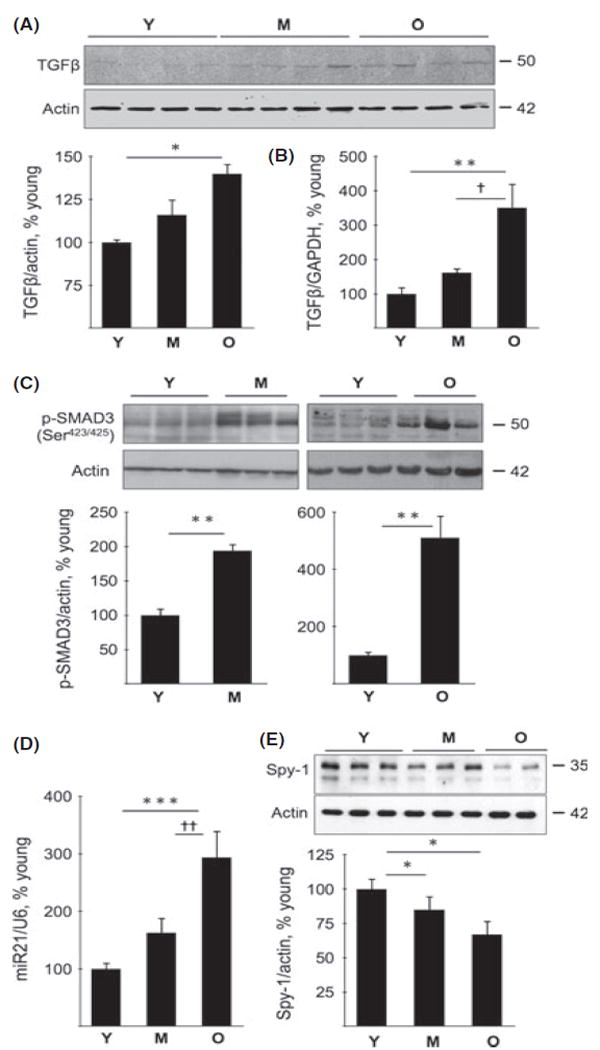
Fig 6.

TGFβ expression and activation, miR21 and Sprouty expression in young (Y), middle-aged (M), and old (O) mice. (A) Immunoblotting of renal cortical homogenates was performed to assess changes in the expression of TGFβ in the middle-aged and old mice. Composite mean ± SE data from four mice in each group are shown in a histogram (*P < 0.05 vs. young mice by ANOVA). (B) Quantitative RT-PCR was performed to assess TGFβ mRNA. Composite mean ± SE data from 5 to 6 mice in each group are shown in a histogram (**P < 0.01 vs. young mice; †P < 0.05 vs. middle-aged mice by ANOVA). (C) Immunoblot analysis of Smad3 phosphorylation in kidney cortical homogenates (representative data from 3 to 6 mice in each group, **P < 0.01 vs. young mice). (D) Real-time PCR was performed to assess changes in miR-21 and U6, the latter serving as control. Composite mean ± SE data from 7 to 8 mice in each group are shown in a histogram (***P < 0.001 vs. young mice, ††P < 0.01 vs. middle-aged mice by ANOVA). (E) Immunoblot analysis of Sprouty-1 (Spy-1) expression in kidney cortical lysates. Composite mean ± SE data from 6 to 8 mice in each group are shown in a histogram (*P < 0.05 vs. young mice by ANOVA).
