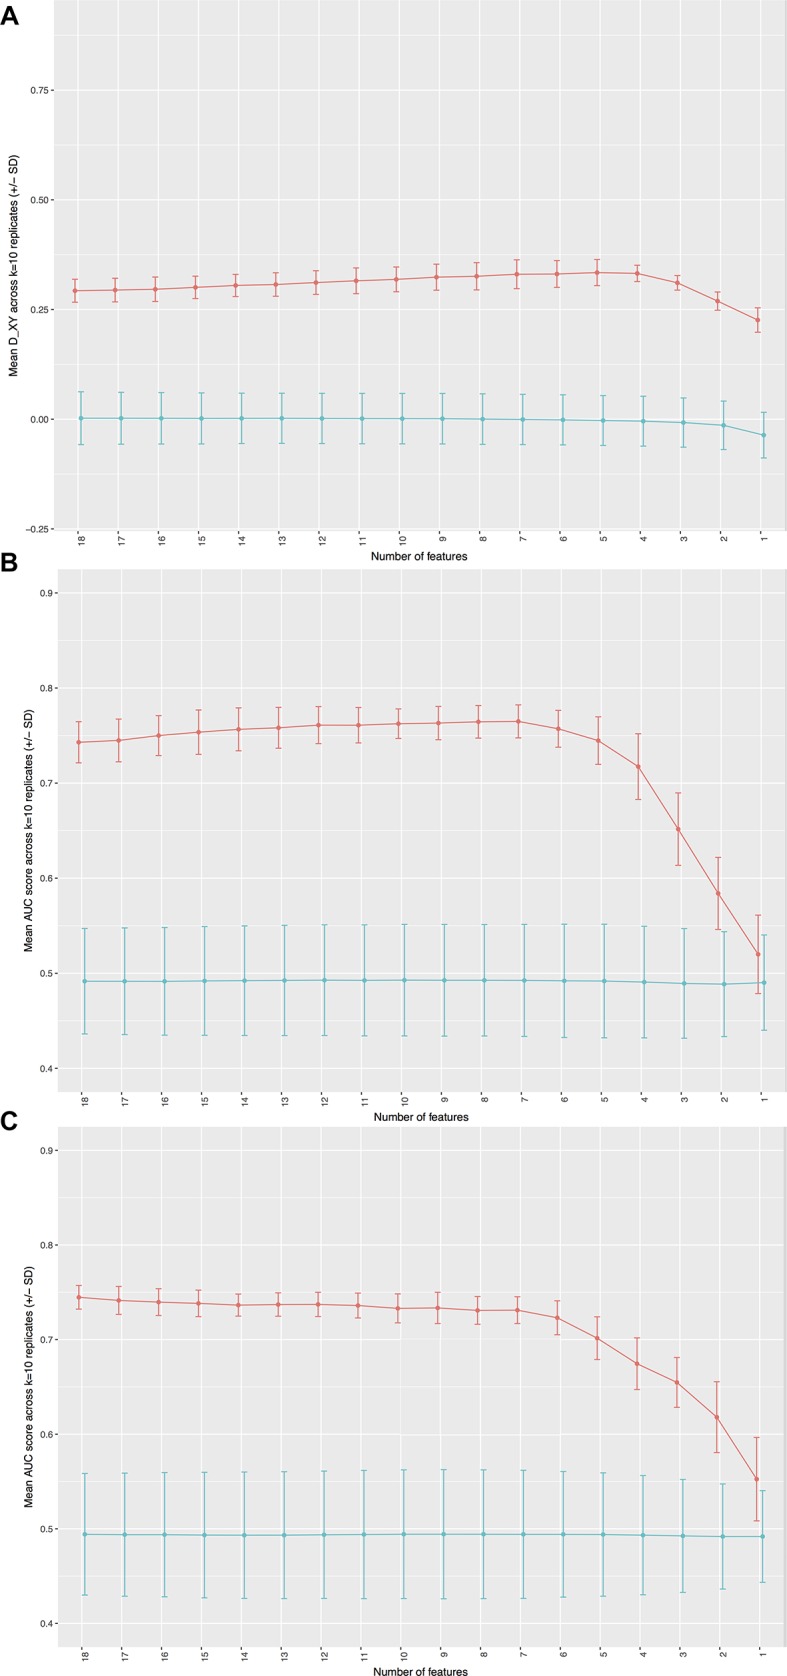
Figure 1.

Model performance as a function of the number of features for actual (red line) and permuted (blue line) data. Performance for overall survival (OS) is measured by DXY for OS (A) and area under the curve (AUC) for <6-month and 12-month OS (Band C, respectively). SDs from replicates of cross-validation are shown for each point as bars.
