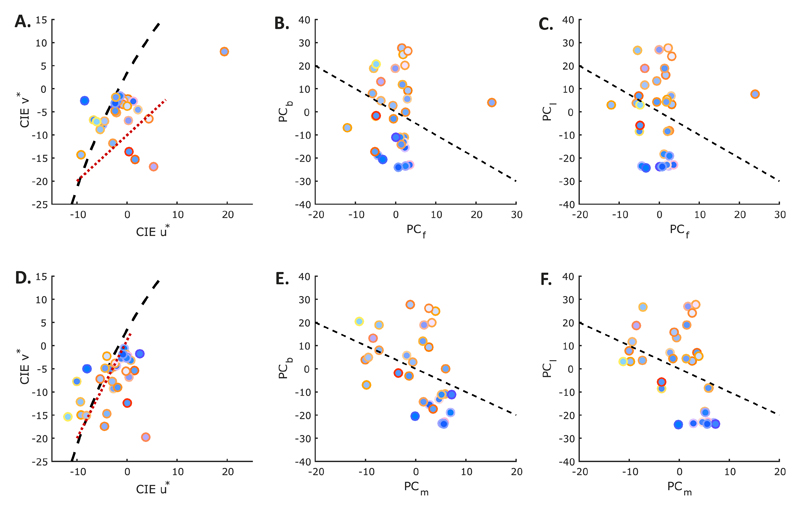
Figure 7.
(A) Achromatic settings with luminance fixed at 24 cd/m2. (B) The first PC of the dress body matches (PCb) plotted against the first PC of the achromatic settings at fixed luminance of 24 cd/m2 (PCf). (C) The first PC of the dress lace matches (PCl) plotted against the first PC of the achromatic settings at fixed luminance of 24 cd/m2 (PCf). (D) Achromatic settings with luminance set at luminance of dress body match (and therefore varying across participants). (E) The first PC of the dress body matches (PCb) plotted against the first PC of the achromatic settings at the luminance of the dress body matches (PCm). (F) The first PC of the dress lace matches (PCl) plotted against the first PC of the achromatic settings at the luminance of the dress body matches (PCm). Red dotted lines are the first PCs of the data. The black dashed line in (A) and (D) is the Planckian locus. Black dashed lines in remaining plots are lines of perfect negative correlation. All markers are pseudocolored according to the corresponding dress body (marker face) and dress lace (marker edge) matches for each participant by converting the CIE Yxy values of the matches to sRGB for display.

