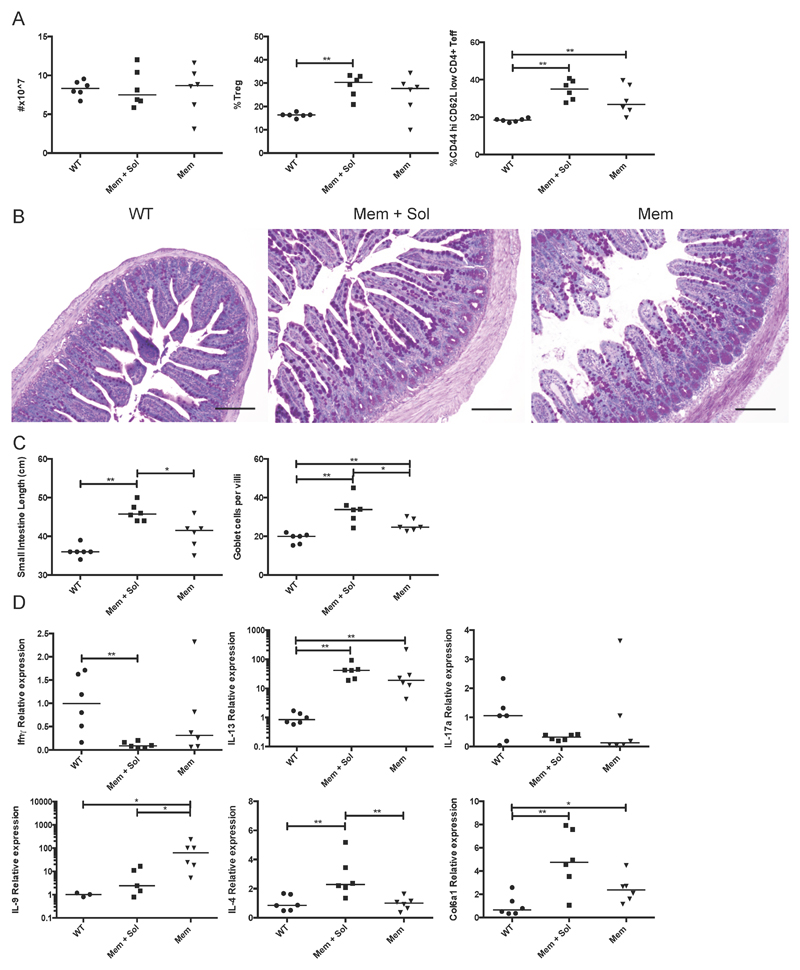
Figure 2. Systemic and small bowel immune cell alterations and pathology induced by Mem vs. Mem+Sol TL1A transgenic mice.
TL1A transgenic mice from the indicated strain and WT littermates were taken at 12 weeks. A Total splenocytes were counted and the fraction of Tregs (CD4+ FoxP3+ of the CD4+ population) and effector T cells (CD44 high CD62L low CD4+ FoxP3- of the CD4+ population) were measured by flow cytometry. B Sections of the terminal ileum were stained with PAS. Scale bars are equal to 150µm. C The length of the small bowel was measured and the mean number of goblet cells calculated for at least 3 full in-plane villi per section. D Cytokine levels as assessed by qPCR in the terminal ileum. Bar indicates median. * 0.05>P>0.01 ** 0.01>P>0.001 using Mann Whitney test.

