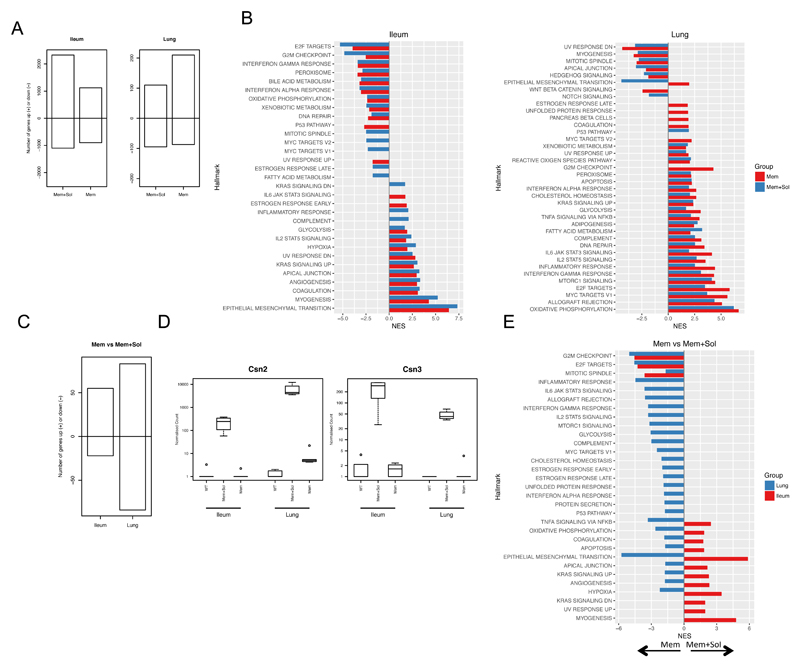
Figure 4. Transcriptional analysis of TL1A transgenic mice.
RNA-Seq was carried out on the ileum and lung from WT, Mem or Mem+Sol mice. A RNA-Seq results from Mem and Mem+Sol were compared to WT mice using DESeq2, and the number of genes with an absolute log2 fold-change in expression greater than 1 between each TL1A transgenic strain and WT were enumerated for both ileum and lung. The positive extreme of the bar indicates the number of genes upregulated and the negative downregulated in the indicated strain and tissue with respect to WT. B Genes resulting from the differential comparisons in A were ranked according to the inverse of the unadjusted p value with the sign of the log2 fold-change and a gene set enrichment analysis was run against the hallmarks data set of MSigDB. Only pathways with FDR less than 0.05 are plotted. The normalized enrichment score (NES) is plotted for each pathway relative to WT. Bars are colored according to the strain examined. C A differential expression analysis was carried out using DESeq2 for Mem+Sol relative to Mem. Numbers of genes filtered as for A were plotted in the same manner. D The normalized counts of Csn2 and Csn3 from the complete dataset. E GSEA for the differential expression analysis from C was carried out as for B. Color of the bar indicates the organ of origin. A positive NES indicates enrichment in Mem+Sol mice and a negative NES indicates enrichment in Mem mice.

