
Figure 3.
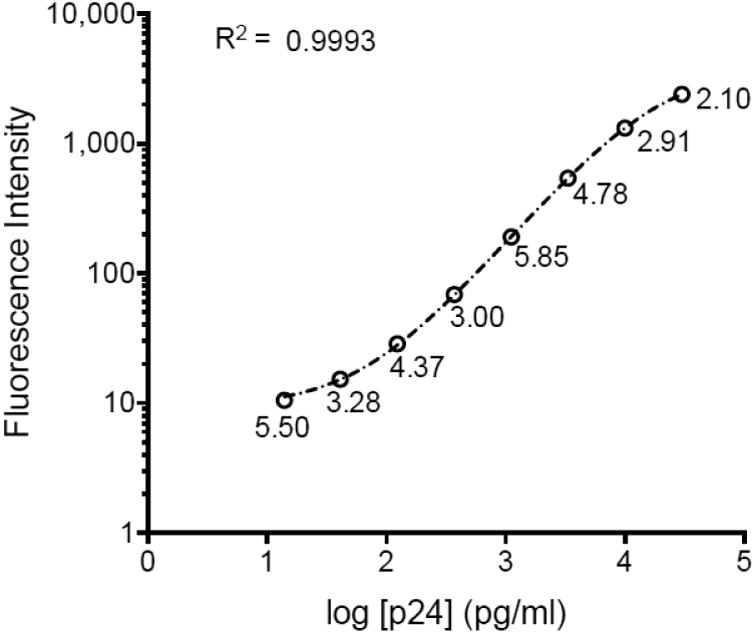
p24 standard curve using the clone 183-H12-5C. The graph represents the mean fluorescence intensity of a standard curve run in quadruplicate fitted by a logistic 5P regression using Prism6, with R2=0.9993. The CV of the data is indicated below each data point..