Figure 4.

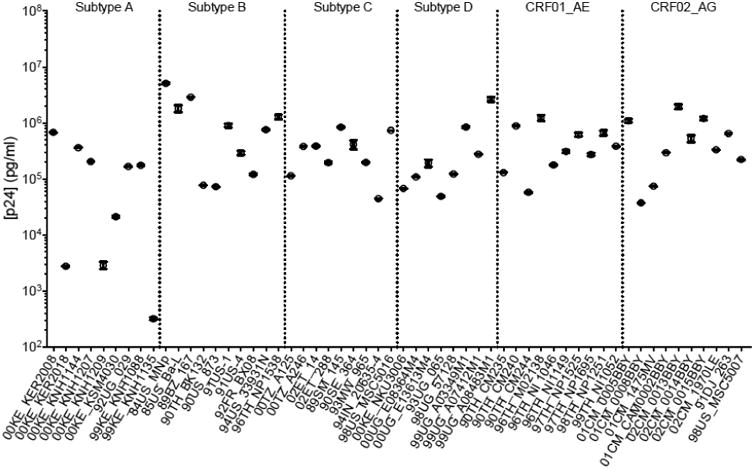
p24 capture Luminex assay of the 56 isolates representing 6 HIV-1 subtypes. The graph represents the mean concentration (in pg/ml) of each sample ran in quadruplicate. The error bars represent the SEM (Standard Error of the Mean).

p24 capture Luminex assay of the 56 isolates representing 6 HIV-1 subtypes. The graph represents the mean concentration (in pg/ml) of each sample ran in quadruplicate. The error bars represent the SEM (Standard Error of the Mean).