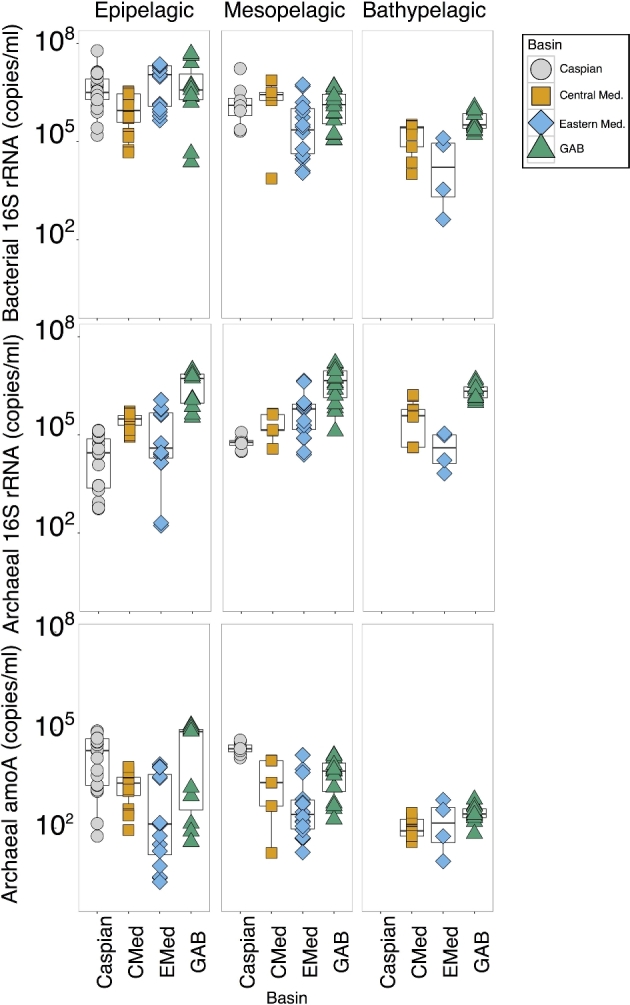
Figure 2.

Abundance of genes by qPCR. Box plot representing copy number of bacterial 16S rRNA, archaeal 16S rRNA and archaeal amoA with samples separated according to basin and depth. Samples from each basin were separated into three depth categories—epipelagic (0–200 m), mesopelagic (200–1000 m) and bathypelagic (1000–4000 m). Shapes and colors of the sample points correspond to the basin from which they were collected.
