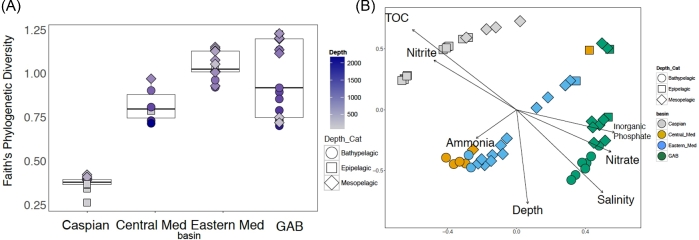
Figure 3.
Diversity of Thaumarchaeotal Oligotypes. (A) Faith's phylogenetic diversity for the Thaumarchaeotal diversity of each sample. Each sample from a basin is shown as a point. Squares represent epipelagic samples (0–200 m). Diamonds represent mesopelagic samples (200–1000 m) and circles represent bathypelagic samples (1000–4000 m). Points are colored based on the depth of sample collection. (B) NMDS of a Bray Curtis dissimilarity matrix prepared from the Thaumarchaeotal oligotype table. Samples from the Caspian Sea are shown in gray, samples from the Central Mediterranean are shown in orange, samples from the Great Australian Bight are shown in Green and samples from the Eastern Mediterranean are shown in blue. Squares represent epipelagic samples. Diamonds represent mesopelagic samples and circles represent bathypelagic samples Environmental factors were fit to this data and environmental parameters that significantly fit the data are plotted as vectors.

