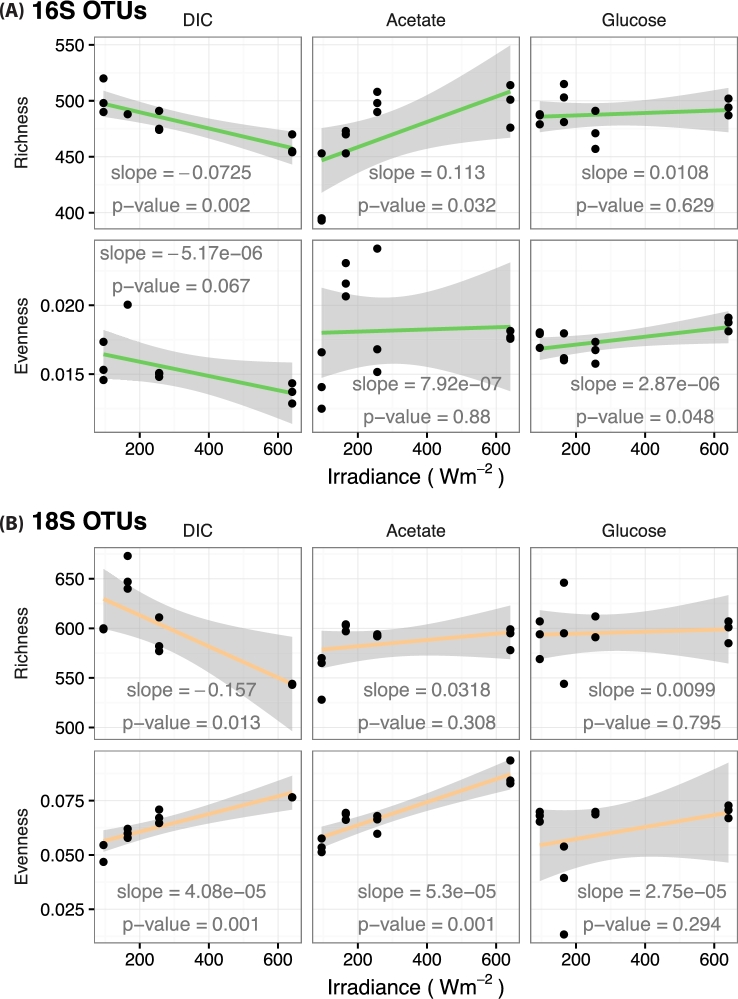
Figure 3.
Alpha diversity trends with light energy input to the system. The data sets are parsed by each substrate treatment: bicarbonate (DIC), acetate and glucose. (A) Changes in bacterial species richness and evenness corresponding to solar irradiance. (B) Changes in microeukaryotic species richness and evenness corresponding to solar irradiance. Broad assignments of increasing or decreasing richness and evenness correspond to positive or negative slopes, respectively. Shaded regions represent the 95% confidence bounds of the linear model.

