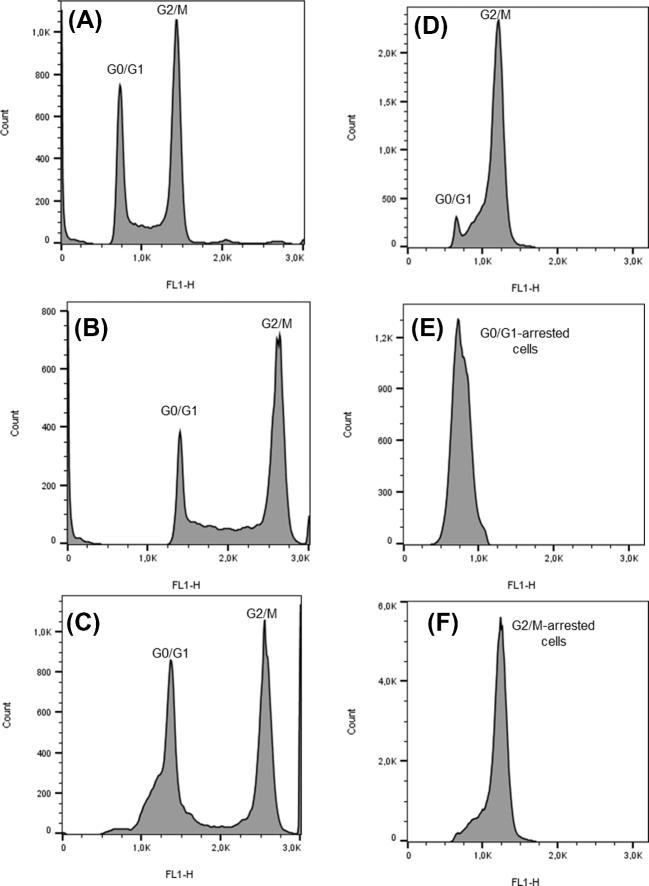
Figure 4.
Cell cycle analysis histograms of S. cerevisiae BY4741 (haploid) (A) and BY4743 (diploid) (B), of the hybrid strain ISA1307 (C) and of Z. bailii IST302 (D–F). Fluorescent intensities of G0/G1 peaks of the cell cycle histograms were estimated by flow cytometry. The mean fluorescence values (FL1-H) obtained for S. cerevisiae haploid (A) and diploid (B) strains were used to build a calibration curve that was used to estimate the size of the genome of Z. bailii IST302 (D). Zygosaccharomyces bailii hybrid strain ISA1307 was used for comparison purposes (C). Zygosaccharomyces bailii IST302 cells were arrested in G0/G1 with 8-hydroxyquinoline (E) or in G2/M with nocodazole (F) in order to confirm the G0/G1 and G2/M peaks and determine the ploidy of the strain.

