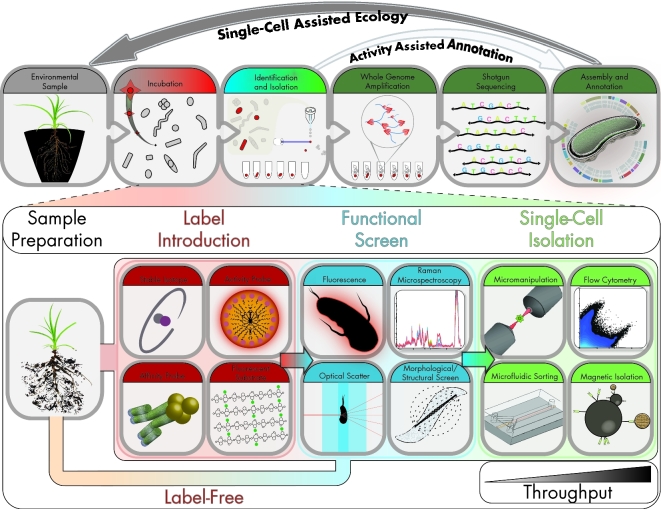
Figure 1.
Flow diagram of function-driven single-cell genomic pipeline. Top panel shows general workflow highlighting how function screen can aid in annotation and ecology of organisms recovered from original sample. Bottom panel highlights specific identification and isolation strategies. Throughput for flow cytometry and magnetic isolation is generally larger than micromanipulation and microfluidic systems.

