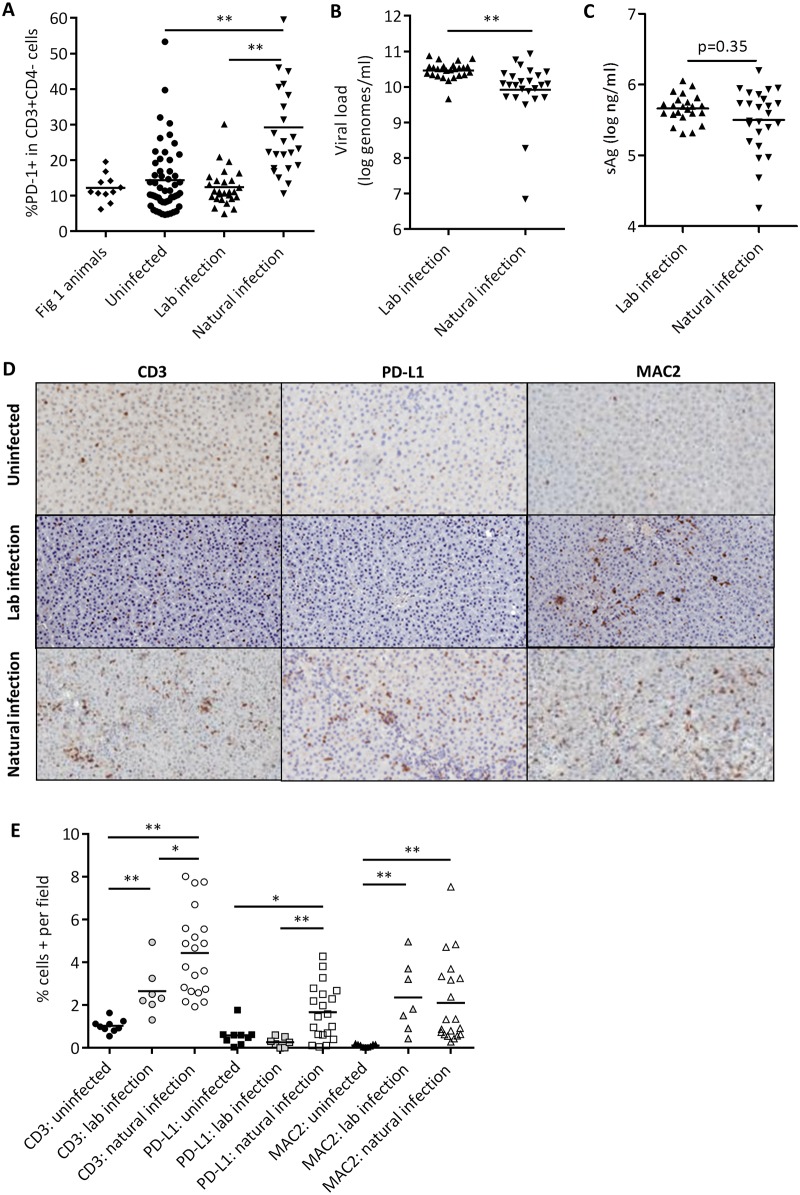
Fig 2. Viral and immune parameters in WHV+ cohorts.
(A) pre-treatment PD-1 expression on CD8 cells (CD3+CD4-) in animals from Fig 1, compared to uninfected woodchucks (n = 52), a separate cohort of chronic WHV+ animals infected via 107 genome equivalent inoculation neonatally (n = 27), or chronic WHV+ animals infected naturally (n = 24). (B) Viral load in lab-infected and naturally-infected chronic WHV+ animals. (C) sAg in lab-infected versus naturally-infected chronic WHV+ animals. (D) Representative images of liver immunohistochemistry for CD3 (left column), PD-L1 (middle column), and MAC2 (right column) from uninfected (top row), lab infected (middle row) and naturally infected (bottom row) animals. (E) Quantification of CD3, PD-L1 and MAC2 staining in 6mm liver punch biopsies from uninfected (n = 9), lab-infected (n = 7), and naturally-infected (n = 20) woodchucks. All statistical comparisons were performed with two-sided Mann-Whitney test. *, p<0.05, **, p<0.001. In A-C and E, each point represents an individual animal, with horizontal bars indicating group means in (A) and (E) geometric means in (B) and (C).

