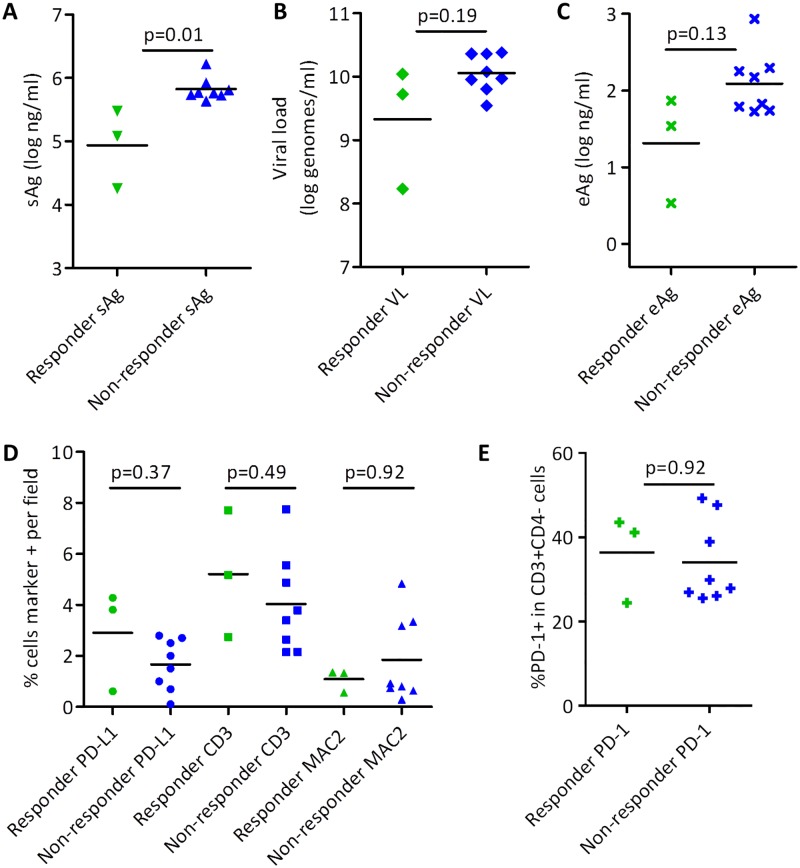
Fig 5. Biomarkers of response.
Pre-treatment sAg (A), viral load (B), eAg (C), liver IHC markers PD-L1, CD3, and MAC2 (D), and PD-1 on peripheral CD3+CD4- (CD8) T cells (E) were compared between αPD-L1-treated animals that showed a treatment response (green) and those that did not (blue). Statistical comparisons were made using two-sided Mann-Whitney test.

