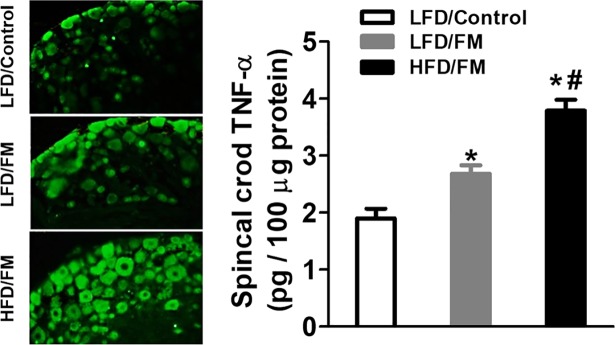
Fig 3. Levels of TNF-α in spinal cord and DRG.
Mice were sacrificed after the last behavioral test, and samples of spinal cord and L3-L5 DRG tissues were collected in separate groups of mice. The concentrations of TNF-α in spinal cord were determined by ELISA. L3-L5 DRG tissues were sectioned to a thickness of 15μm and underwent immunofluorescent staining. The images were quantitatively analyzed by NIH ImageJ. *represent the significant difference (p<0.05) to saline control mice. #represents the significant difference (p<0.05) to low fat diet mice. N = 8/group.

