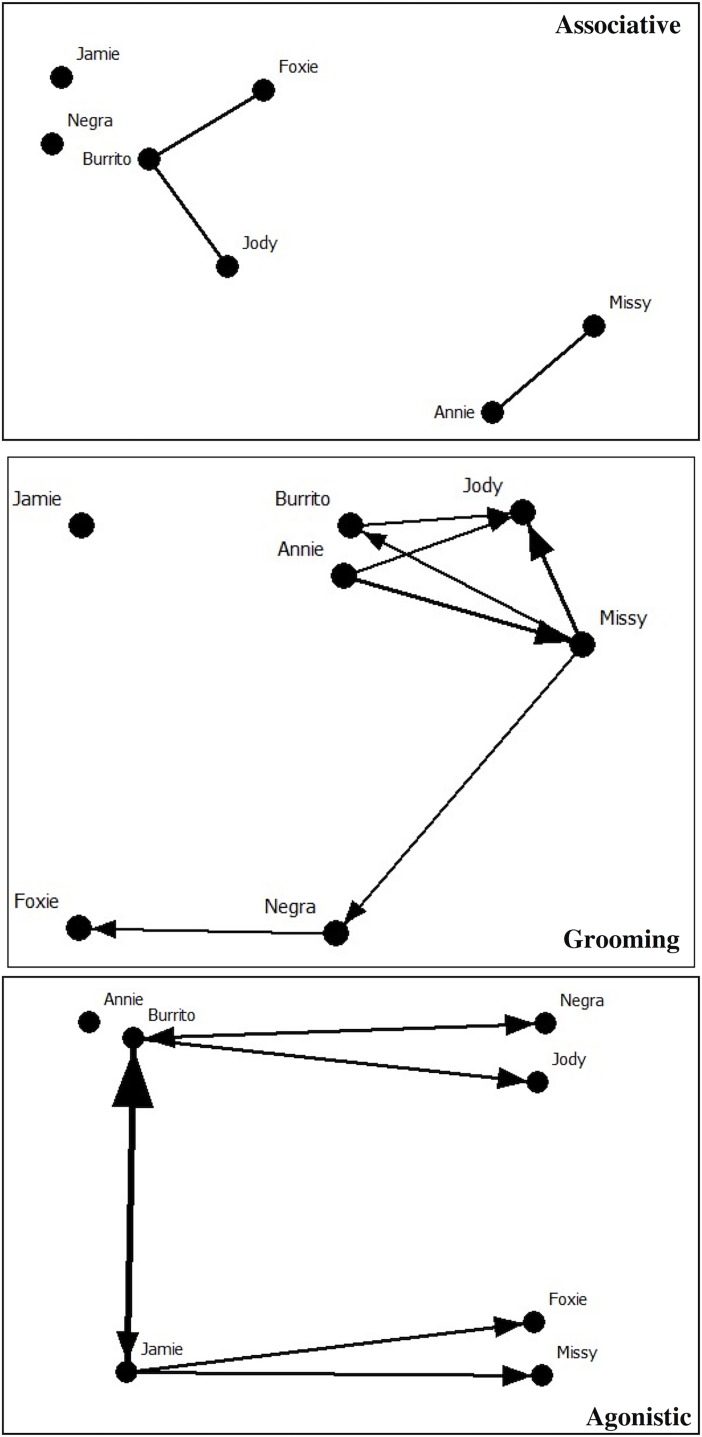
Fig 2. Associative, grooming, and agonistic principal coordinate analyses.
The principal coordinates format was used to construct an associative, grooming, and agonistic network diagram drawn in NetDraw [55] using dyadic indexes derived from SOCPROG [52]. Edges are defined by the mean of all dyadic association indexes plus one standard deviation (M+1 SD). The grooming and agonistic diagrams depict directional relationships with line and arrow width representing relationship value.

