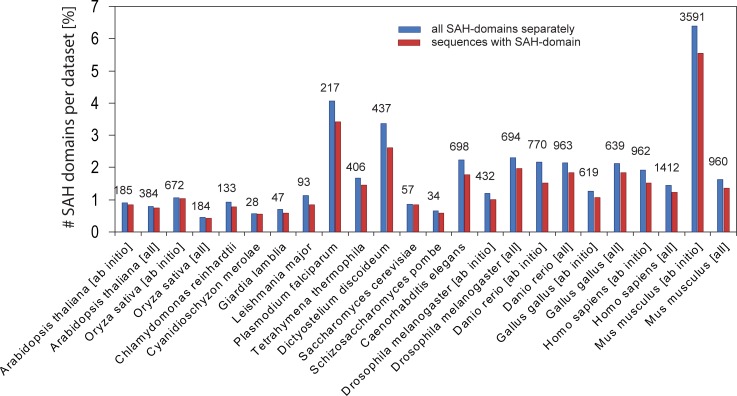
Fig 1. SAH-domains in eukaryotic genomes.
The plot presents the percentage of SAH-domains with respect to total numbers of processed sequences per datasets. The blue bars represent all SAH-domains, while the red bars represent all sequences containing at least a single SAH-domain. The numbers on top of the blue bars denote the total numbers of predicted SAHs (see also Table 2). The window size for identifying SAHs was 21 amino acids. For an explanation of the difference between “all” and “ab initio” datasets see Table 1.

