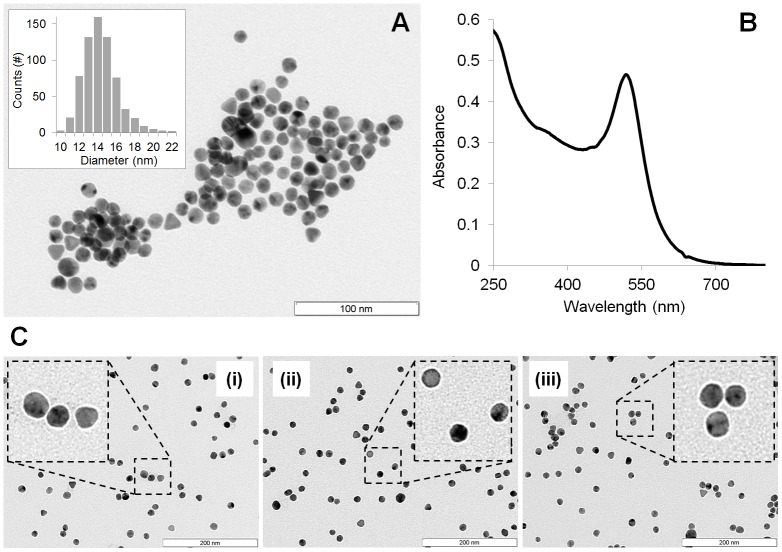
Fig 2. Gold nanoparticle characterisation.
(A) TEM image of citrate-gold nanoparticles (scale bar = 100 nm). Inset: size distribution histogram showing an average diameter of 14.4±2.0 nm. (B) UV-Vis spectra of the synthesized GNPs with the characteristic surface plasmon resonance (SPR) peak at 519 nm. (C) TEM image of antagomiR-gold nanoparticles (scale bar = 200 nm) (i) = NS (ii) = 5A (iii) = 3As.

