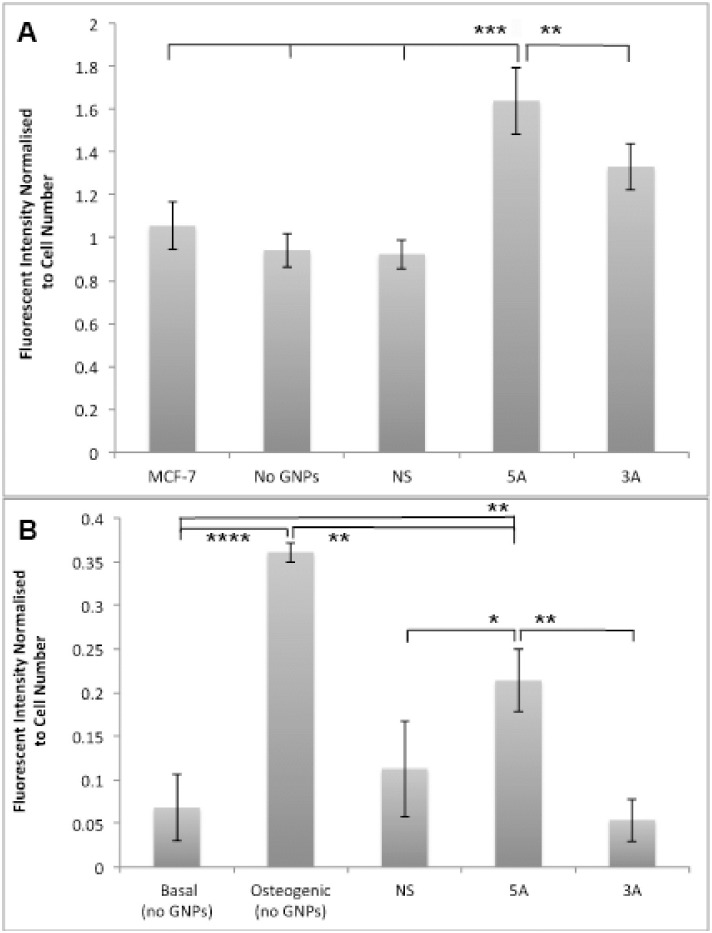
Fig 6. In cell western data of osterix protein levels.
(A) at day 5 in MG63s after 48 hours incubation with GNP treatments normalised to cell number and to PEG GNPs, and in MCF-7 cells (n = 6; error bars denote standard deviation); (B) at day 7 in MSCs after 48 hours incubation with GNP treatments normalized to cell number and to PEG GNPs. (n = 6; error bars denote standard error, **** = p<0.0001; *** = p<0.001; ** = p<0.01 compared to no GNPs).

