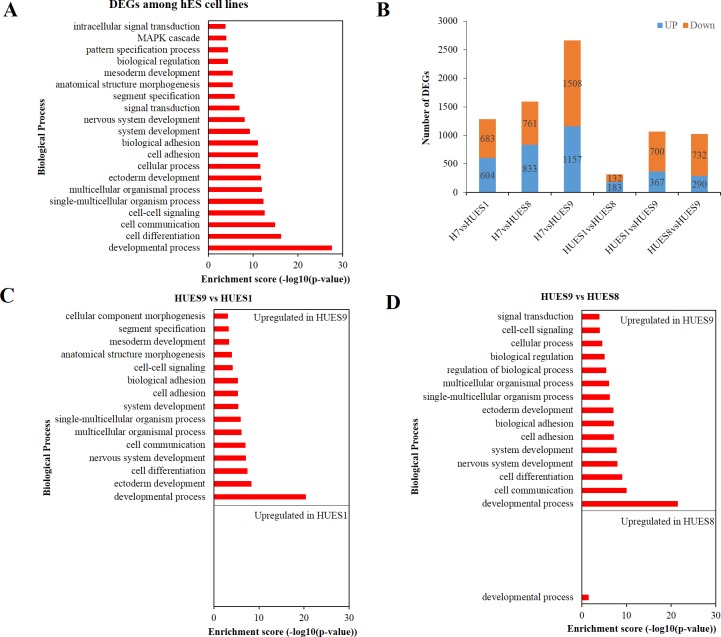
Fig 3. Transcriptional variability among hESC lines H7, HUES1, HUES8 and HUES9.
(A) GO-slim biological process enrichment analysis of DEGs at least between two lines. Result shows that these global DEGs are significant enriched in developmental process. (B) Histogram depicting number of DEGs between any two cell lines. HUES1 and HUES8 have the least DEGs compared to other two-two compares. (C) GO-slim biological process enrichment analysis of DEGs between HUES9 and HUES1. (D) GO-slim biological process enrichment analysis of DEGs between HUES9 and HUES8. Although HUES1 is female while HUES8 is male, their expression profiles are more similar than other cell lines. GO-slim enrichment analysis indicates that their DEGs show no significant enrichment in biological process. Compared to HUES9, upregulated genes (logFC > 1 and FDR < 0.01) in these two cell lines exhibit significant enrichment in endoderm development (Note: HUES1 and HUES8 refer to GO complete biological process data, S7 Table) while upregulated genes of HUES9 significantly enriched in nervous system development and ectoderm development. Other results of GO-slim biological process enrichment analysis please see S2 Fig.

