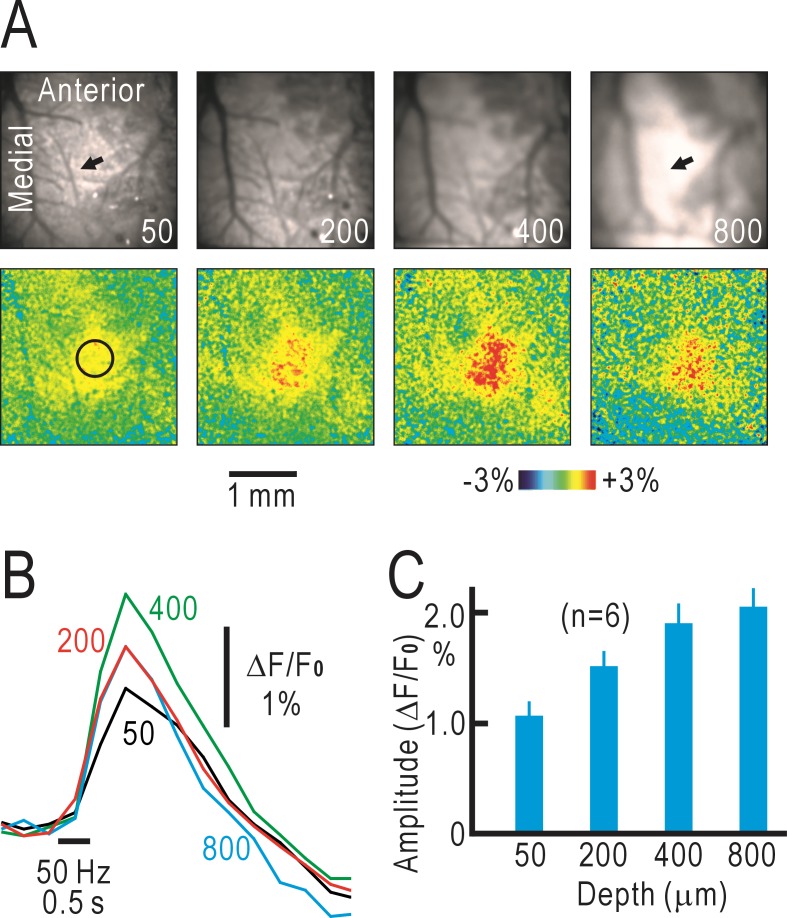
Fig 2. Tomographic imaging of cortical responses in untreated mice.
(A) Original tomographic images in the right S1 (upper panels) and pseudo-color images of fluorescence responses elicited by vibratory stimulation at 50 Hz for 0.5 s applied to the left forepaw (lower panels). The numbers in the upper panels represent the depth (μm) from the cortical surface. The two arrows in the upper panels show the position of an artery that is visible in the leftmost panel but not in the rightmost panel. The circle in the leftmost lower panel shows the circular window in which response amplitudes were measured in ΔF/F0. (B) Time courses of the fluorescence responses measured at 50, 200, 400 and 800 μm deep from the cortical surface using a macroconfocal microscope. Data in (A) and (B) were obtained from the same mouse. (C) Amplitudes of fluorescence responses measured at each depth.

