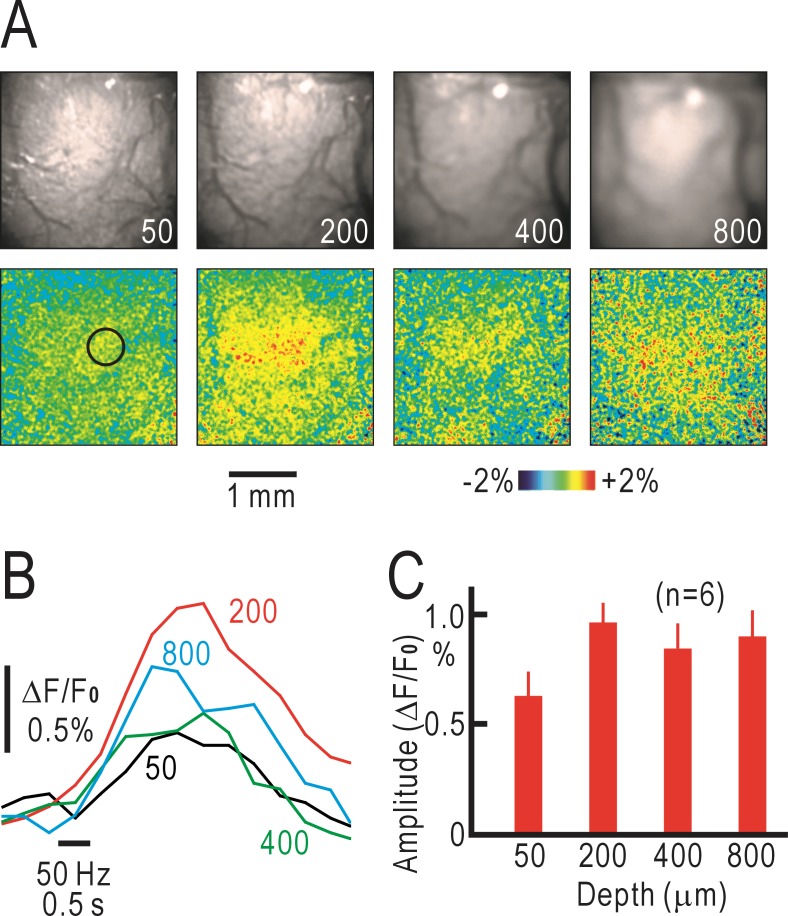
Fig 3. Tomographic imaging of cortical responses in operated mice.
(A) Original tomographic images in the right S1 (upper panels) and pseudocolor images of fluorescence responses elicited by vibratory stimulation at 50 Hz for 0.5 s applied to the left forepaw (lower panels). (B) Time courses of the fluorescence responses measured at 50, 200, 400 and 800 μm deep from the cortical surface using a macroconfocal microscope. Data in (A) and (B) were obtained from the same mouse. (C) Amplitudes of fluorescence responses measured at each depth.

