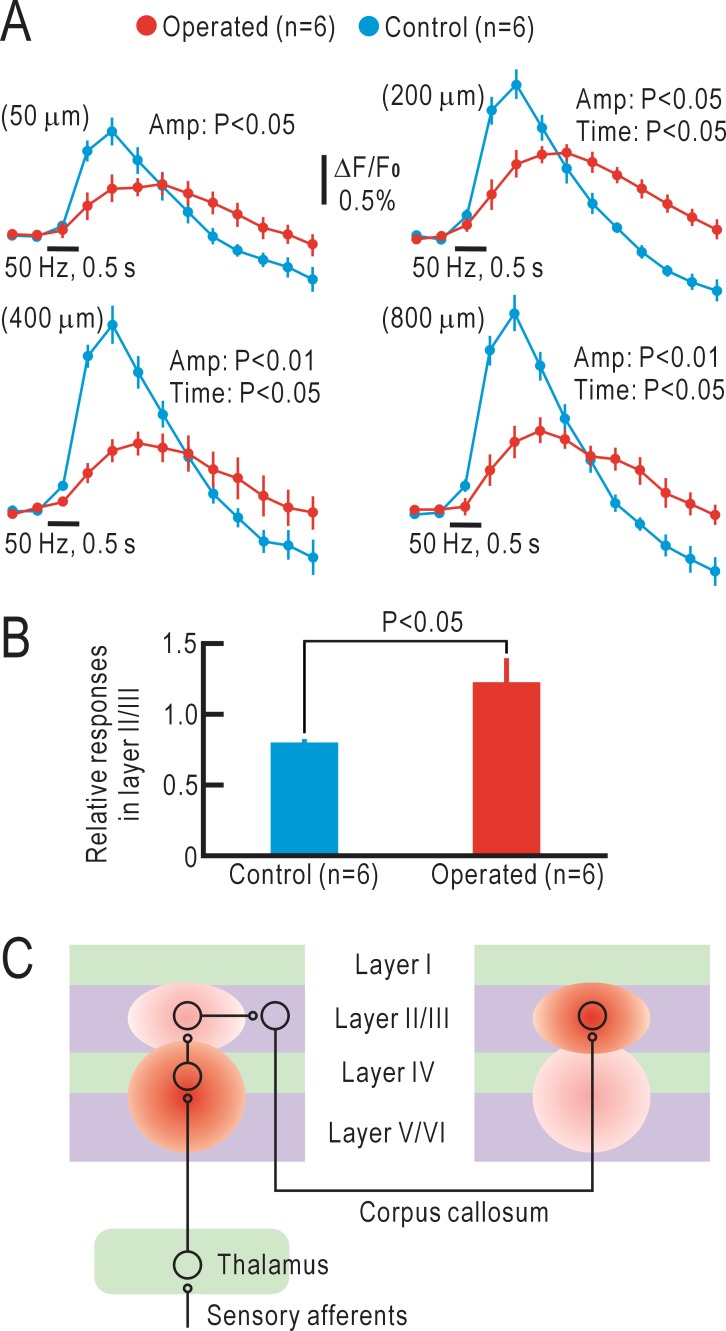
Fig 4. Comparison of cortical responses between untreated and operated mice.
(A) Time courses of the fluorescence responses measured at 50, 200, 400 and 800 μm deep from the cortical surface using a macroconfocal microscope. Statistical differences were evaluated regarding the peak amplitude and peak latency between the untreated and operated mice. (B) Relative response amplitudes at 200 μm normalized to those at 400 μm. This ratio is smaller than 1.0 in the untreated mice, while it was larger than 1.0 in the operated mice. (C) Schematic drawing of the neural circuits in the operated mice.

