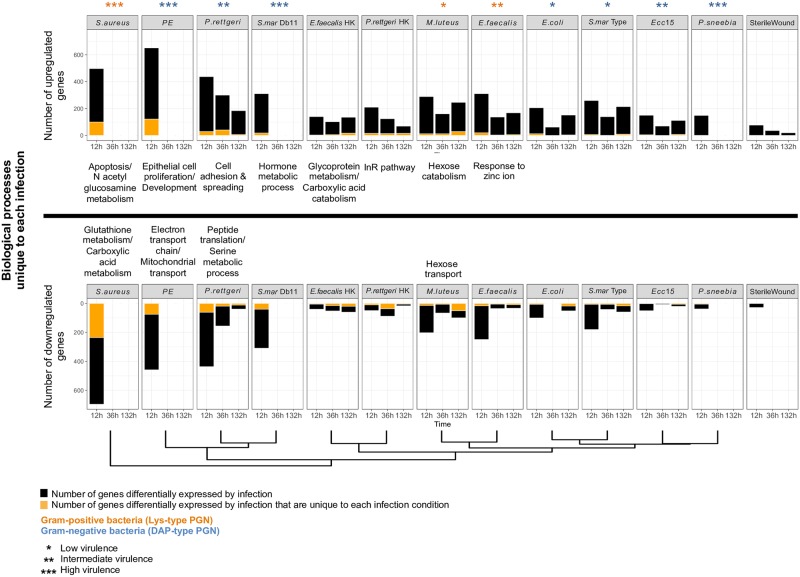
Fig 2. The host response to bacterial infection is diverse.
(A) Number of genes differentially regulated by each infection (black bars) and number of genes differentially expressed by infection that are unique to each individual bacterium (orange bars). This information is listed separately by time point for each infection. Upregulated and downregulated genes are above and below the horizontal demarcation line, respectively. The biological processes regulated exclusively in response to each individual bacterium, if any, are listed adjacent to each bacterium. These biological processes are also separated by the horizontal demarcation line depending on whether they are upregulated (above) or downregulated (below) by each infection. The relative level of virulence of each bacterium is indicated by the number of stars: *Low virulence, **Intermediate virulence, ***High virulence. The type of bacterial peptidoglycan is indicated by the color of the stars: orange (bacteria with Lys-type PGN) and blue (bacteria with DAP-type PGN). The clustering of infection conditions (shown at the bottom of the graph) is based on the similarities of the expression patterns measured at 12 h.

