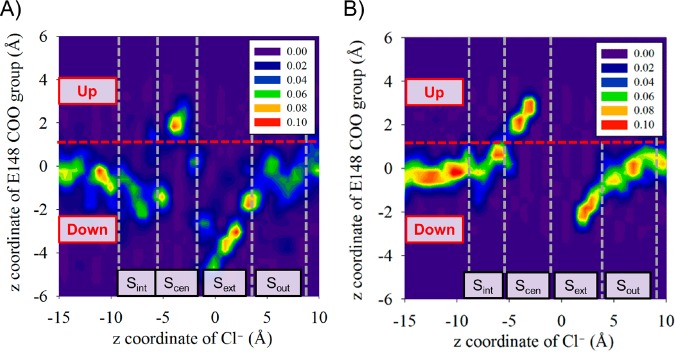
Figure 5.
Probability distribution of the rotation state of the carboxyl group of E148 as a function of the position of Cl–, with E148 protonated (A), and deprotonated (B). The distance along the z axis from the center of mass of alpha carbons of protein (the same origin for the Cl– position) to the center of mass of the carboxyl group of E148 is calculated from the trajectories of 2D umbrella sampling windows. E148 is in the “up” state in both protonated and deprotonated states when Cl– is present at Scen. The red lines at the middle of both plots represent a boundary between our definitions of the “up” and “down” positions of E148 in the MKM.

