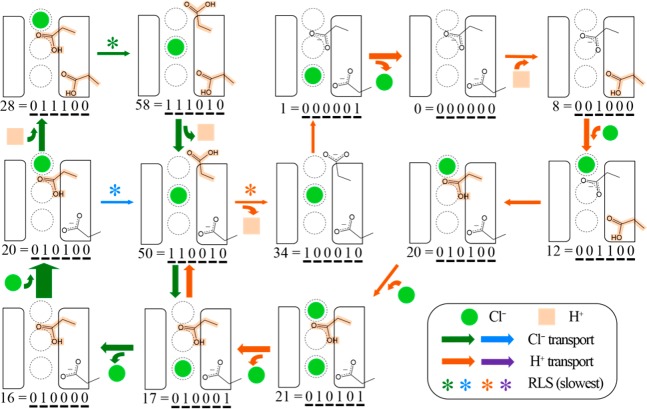
Figure 8.
The five pathways (1 H+ in orange, 2 Cl– in green and green/blue, and 2 combined H+/ Cl–) that contribute most to ion transport for the biological orientation from one of solution set to the MKM, as described in the main text. The images and numbers represent the protein state (see Figure 3). The width of each arrow is proportional to the rate of transition with the RLS highlighted by an asterisk. The pH (4.5) and Cl– gradient (300 mM external and 1 mM internal) of the system are the same as in Figure 7.

