
Figure 2. Effect of TLR2 and TLR9 agonists on the FcμR expression by B cell subsets.
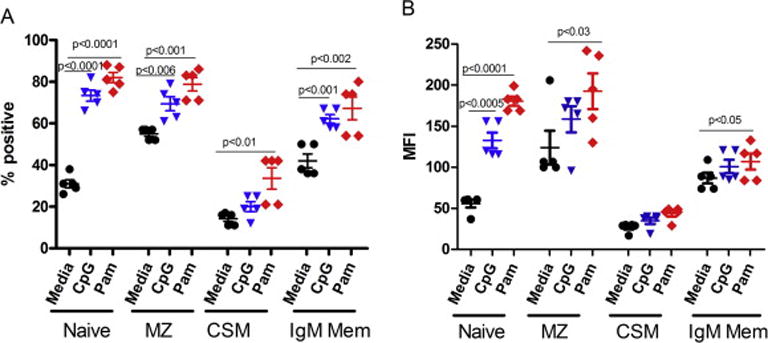
PBMCs from controls were cultured in the absence (media) or presence of CpG (10 μg/ml) and Pam3 (5 μg/ml) for 24 hours. Percentage of FcμR+ B cells (A) and MFI of FcμR (B) were determined in each B cell subset by multicolor flow cytometry (n = 5). Each symbol represents data from an individual. The horizontal wide and narrow bars indicate the arithmetic mean and 1 SE, respectively. Note the significant upregulation of FcμR expression, especially its density, on naive, MZ and IgM memory B cells by TLR2 agonist (Pam3) stimulation.