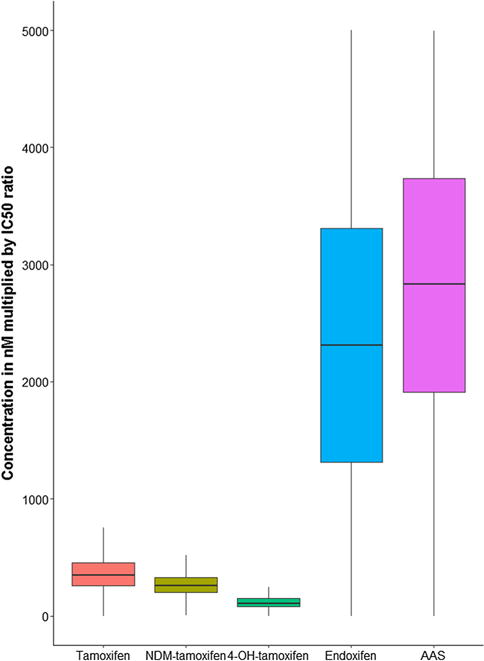
Fig. 3.

Boxplots for the concentration of each metabolite multiplied by its IC50 ratio representing the relative contribution to the AAS. Values greater than 1.5 times the upper value of the interquartile range are considered as outliers and removed from the plot
