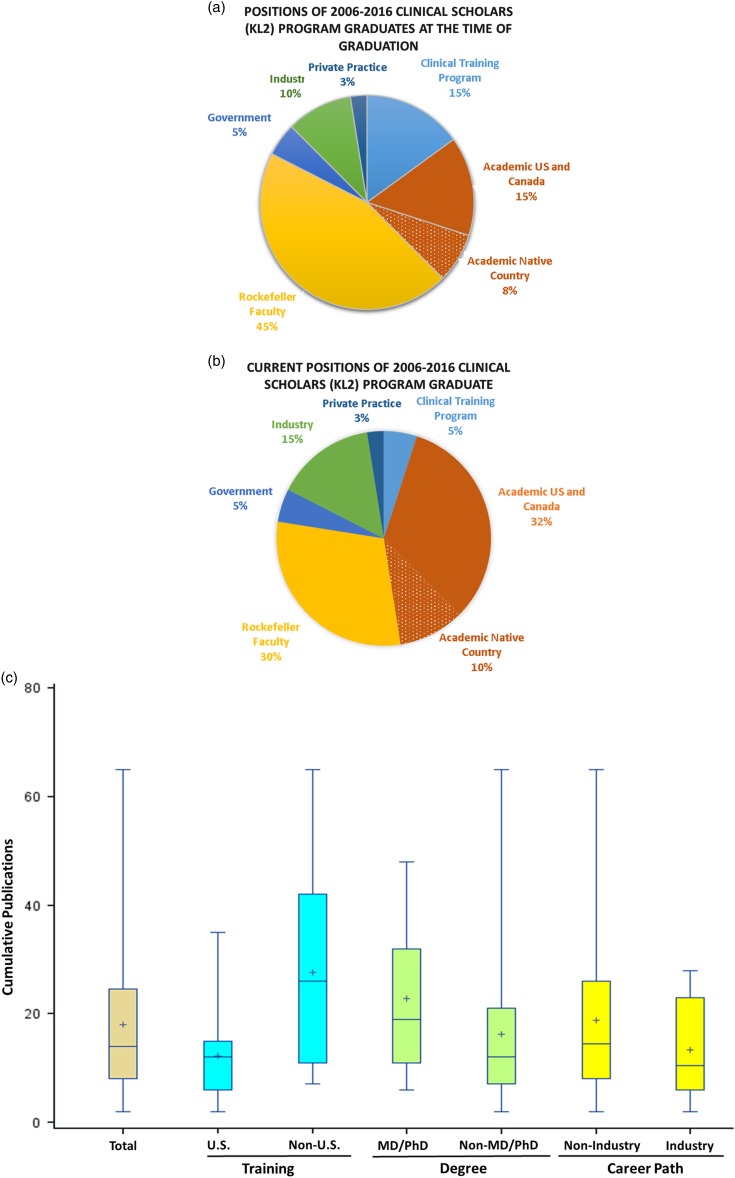
Fig. 1.
Clinical Scholar graduates. (a) Positions of 2006–2016 Clinical Scholars program graduates at the time of graduation. (b) Current positions of 2006–2016 Clinical Scholars program graduates. (c) Cumulative publications of Clinical Scholars to 2016. Data depicted as box plots with the median value indicated by the line in the box; the mean indicated by the + sign in the box; the box encompassing 50% of the values; and the extensions encompassing the upper and lower values.

