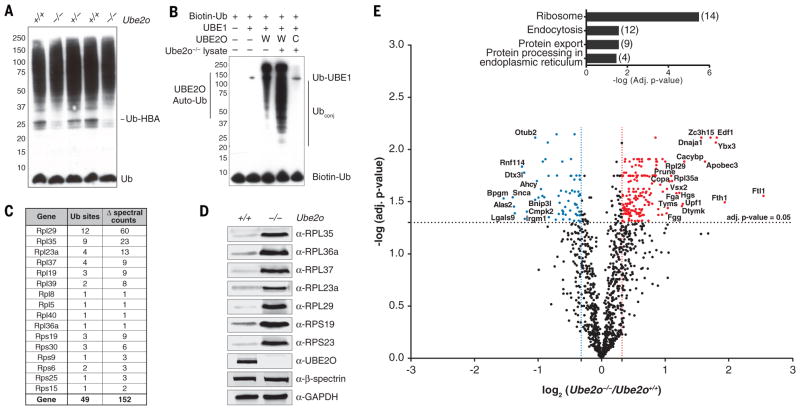
Fig. 1. Ube2o−/− reticulocytes are deficient in eliminating ribosomal proteins.
(A) Proteins from reticulocyte lysates were resolved by SDS-PAGE and immunoblotted with an anti-ubiquitin antibody. Each sample is from a different mouse whose reticulocytes were induced by serial bleeding.
(B) Ubiquitination was reconstituted in Ube2o−/− reticulocyte lysates using recombinant UBE2O. Reactions were supplemented with biotin-tagged ubiquitin and ubiquitin activating enzyme (UBE1), and incubated for 45 min at 37°C. Samples were resolved by SDS-PAGE. Proteins were electroblotted and visualized using streptavidin-HRP. The catalytically inactive C1037A mutant (UBE2O-CA) was used as a control. UBE2O-CA did not have conjugating activity in lysates, as the only bands evident in this case were biotin-ubiquitin and autoubiquitinated E1. In the absence of lysate, UBE2O was autoubiquitinated, as previously reported (27). W, UBE2O-WT; C, UBE2O-CA.
(C) UBE2O ubiquitinates ribosomal proteins in reconstituted Ube2o−/− lysates. Ubiquitin conjugates (see Fig. 2A) purified by NeutrAvidin-biotin pulldown were digested on beads with trypsin. Peptides containing di-glycine modified lysines (ubiquitination sites) were identified and mapped by LC-MS/MS. All ribosomal protein ubiquitination events were unique to the wild-type UBE2O sample. Δ spectral counts denotes subtraction of all spectral counts collected in the UBE2O-CA sample from those of the UBE2O-WT reaction for a given di-glycine peptide over six replicate experiments. Ub sites, unique ubiquitination sites identified.
(D), Levels of ribosomal proteins from Ube2o−/− and wild-type reticulocytes assessed by immunoblotting. GAPDH and β-spectrin are loading controls. 100 μg of protein was loaded per lane.
(E) Volcano plot of quantitative proteomics analysis, representing the relation of the log10 of the p-value adjusted using Benjamini-Hochberg correction [-log (adj. p-value)] and the log2 of the fold change [log2 (Ube2o−/−/Ube2o+/+)]. Proteins significantly (adj. p-value < 0.05) upregulated or downregulated at least 25% in Ube2o−/− samples were displayed in red and blue respectively. Highly significant enrichment of ribosomes (adj. p-value=3.23 x 10⁻⁶) was found by KEGG pathway enrichment analysis of all proteins upregulated significantly and by more than 25% in Ube2o−/− reticulocytes. Brackets, number of proteins per group.

