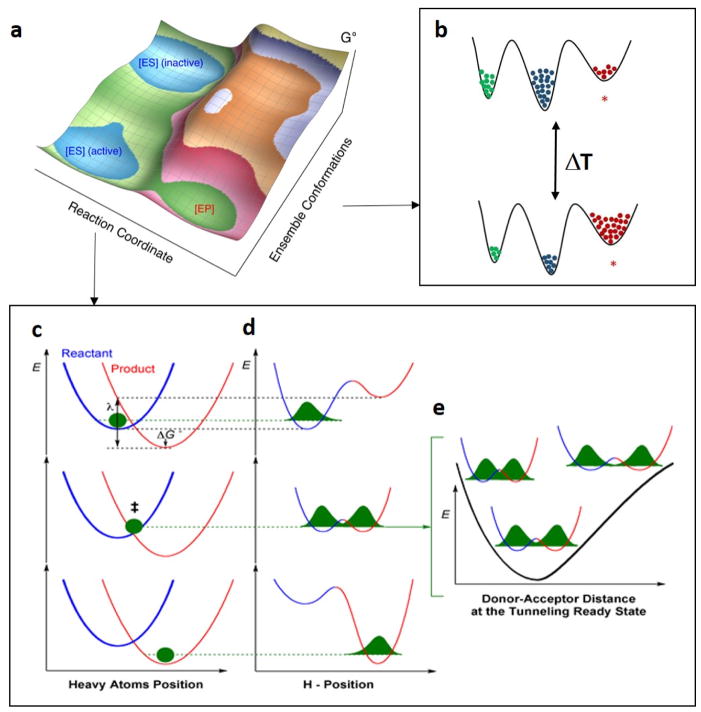
Figure 13.
A general multidimensional model for hydrogen transfer in SLO and ht-ADH.31,36,51 (a) Schematic representation of a free-energy landscape for the enzyme-substrate complex, that takes into account both the reaction coordinate for H-transfer and a conformational landscape coordinate; only some fraction of the E-S complex (labelled active) is competent to carry out catalysis. (b) Cartoon model of a stochastic conformational landscape. The conformational sampling landscape of enzyme is represented by a solid black line, with increasing energy along the vertical axis. For the example, only three enzyme substates are shown and colored in green, blue and red. The substate colored in red is designated as the catalytically active configuration, and the other two states are either inactive or poorly active. The ΔT is to represent the impact of temperature on the conformational coordinate. Panels (c)-(e) show the three slices of the energy surface along the reaction coordinate defined by ktun (Eq 2). Panel (c) represents the motions of the heavy atoms of protein that optimize ΔG° and λ for hydrogenic wave function overlap between the reactant (blue) and product (red) potential wells. Panel (d) illustrates the hydrogen wave functional overlap that occurs upon reaching transient degeneracy between the reactant and product wells. Panel (e) presents the effective potential surface along the DAD coordinate at the tunneling ready state and illustrates the additional role of DAD sampling on the efficiency of wave function overlap.

