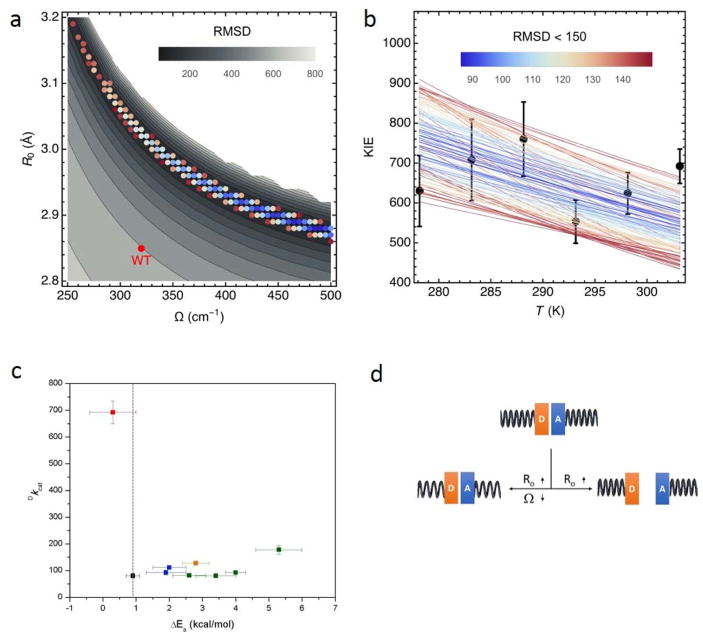
Figure 2.
Vibronic nonadiabatic tunneling model fits of the experimental KIE data for DM-SLO. The experimental data for the temperature dependence of the KIE (black circles with error bars) are shown in b), together with the theoretical curves for different sets of the equilibrium DAD, R0, and DAD sampling frequency, Ω (colored lines). The colors of the lines represent the RMSD (upper bar) calculated as the differences between the theoretically predicted and experimentally measured KIEs for the six experimentally measured temperatures for a given R0 and Ω. The mass of the DAD sampling mode was chosen to be 14 amu as determined in independent molecular dynamics (MD) simulations of WT SLO. The panel a) shows the data for RMSD<150 (colored dots using same color scheme for the RMSD as in b), in relation to all possible fits (grey background) with 500 cm−1 as the upper limit for Ω.51 In c) the Dkcat value at 30 °C is plotted vs the Ea value for WT (black),42 I553X series (green),44 L546A and L754A (blue),42 other double mutant L546A/I553A (orange),55 and double mutant L546A/L754A (red).51 The vertical dashed line represents an extrapolation of the temperature-dependence of WT (Ea = 0.9 kcal/mol). In d) the different patterns that connect the changes in R0 and Ω are shown. A close distance between the H-donor (D) and H-acceptor (A) is expected from the properties of WT SLO. Below and pointing left, the initial increase in R0 (and accompanying decreases in Ω) can be compensated by DAD distance sampling, allowing recovery to WT-like behavior. Below and pointing right, only R0 gets elongated while Ω remains the same or even increases, as in the case of DM-SLO. The tightness of the spring represents the frequency of DAD sampling.

