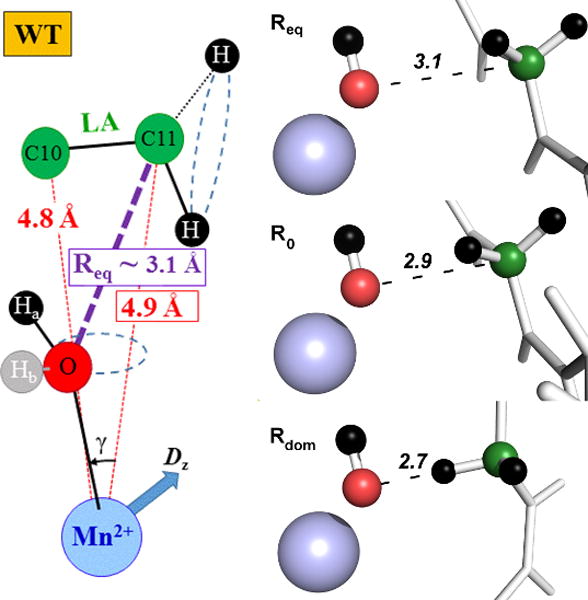
Figure 3.

Model for active-site ground-state structure of WT SLO ES complex. a) The distances represented by the red dotted lines are ENDOR derived distances; the Mn-O distance is obtained from the X-ray crystal structure, (2.23 Å). The angle, γ = 26°, was calculated from MD simulations using ENDOR derived distances as restraints. The position of 1Hb was not well established and it is arbitrarily pictured (in grey), for completeness. The purple dashed line represents ground state equilibrium DAD distance (Req) calculated trigonometrically. The uncertainty of the C11-O distances was estimated as ± 0.2 Å. Dashed blue circles suggest the oxygen nucleus lies out of the x-z plane of the ZFS axes.57 b) A physical picture for the tiers of distances relevant for bringing the DAD from Req to Rdom, where 2.7Å represents the dominant distance for efficient hydrogen transfer by tunneling. The numbers in italics refer to the DAD in Angstroms. A physical picture of protein motions linked to the conversion of Req to Rdom can be found in Figure 13.
