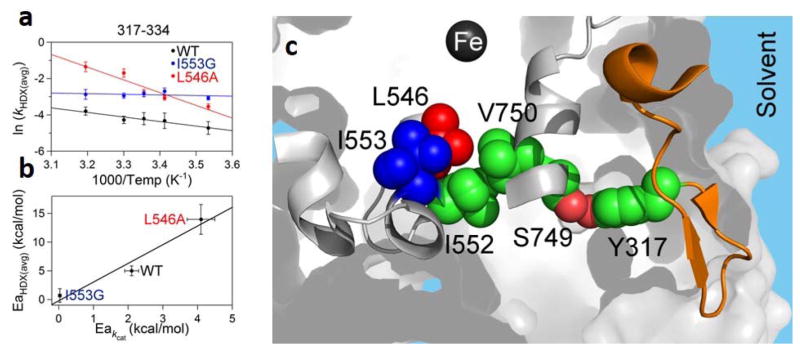
Figure 8.
Correlated activation energies for HDXMS (317–334) and kcat in SLO.81 a) The Arrhenius-like plots of the weighted average exchange rates constants, ln(kHDX(avg)), for peptide 317–334, are compared for WT, I553G and L546A. b) The correlation between trend in Ea[kHDX(avg)] and Ea[kcat] (Table 1). c): Peptide 317–334, which exhibits mutant variable Ea[kHDX(avg)], is colored orange. The residues predicted to be involved in the pathway of communication from this loop to the active site are shown in green spheres; L546 and I553 side chains are also included in this pathway and colored red and blue, respectively. The catalytic iron is shown as a dark gray sphere. A hydrogen bonded interaction between S749 and Y317 is colored in salmon.

