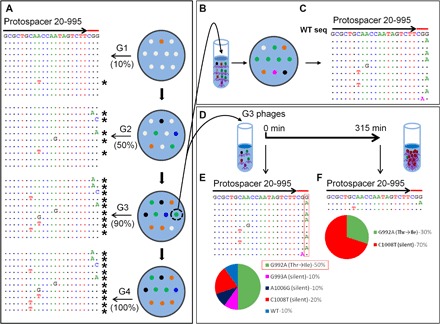
Fig. 3. Selection of CEMs in the portal protein gene.

(A) Plaques produced from WT phage T4 infection of CRISPR–E. coli DH5α expressing spacer 20-995 (G1) were transferred to a fresh plate, and the process was repeated (G2 to G4). The DNA from single plaques was amplified and sequenced. Left: Alignment of sequences in the same manner, as described in legend to Fig. 1. (B) The mixture of phages from a G3 plaque was separated by serial dilution, and single plaques produced by individual variants were sequenced (C). “WT seq” indicates the wild-type sequence of protospacer. (D and E) To determine the relative fitness, we used the same phage mixture to infect E. coli DH5α expressing spacer 20-995 in a liquid culture. Single plaques obtained from the progeny produced after 315 min of infection were picked and sequenced (D). The percentages of each CEM in the starting sample (E) and after 315 min (F) of evolution are shown below as pie charts. The spacer and PAM sequences are marked with arrows and red lines, respectively. See Materials and Methods for details.
