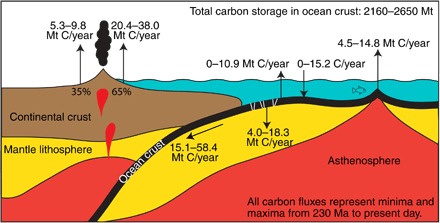
Fig. 1. Schematic diagram showing oceanic crustal carbon cycle.

Values indicate maximum and minimum carbon fluxes for the oceanic crustal carbon reservoir since 230 Ma. Downward-pointing arrows indicate that the carbon is sequestered into the crust or mantle. Upward-pointing arrows indicate carbon flux into the atmosphere. The ocean crust acts as either a sink or source of atmospheric carbon depending on its changing capacity to hold CO2 through time, subject to fluctuations in the age-area distribution of ocean crust and changes in bottom water temperature. The percentage of subducted carbon degassing into the atmosphere is not well known, and we show end-member fluxes based on 35 and 65% of subducted carbon escaping into the atmosphere.
