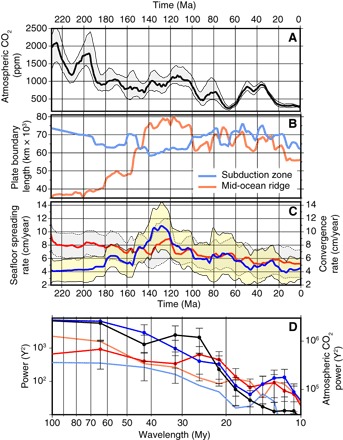
Fig. 2. Atmospheric CO2 and tectonic model components.

(A) Atmospheric CO2 through time with 68% confidence intervals (4). (B) Mid-ocean ridge length (orange) and subduction zone length (light blue) through time based on the study of Müller et al. (19). (C) Seafloor spreading rates (red) and convergence rates (dark blue) from the study of Müller et al. (19). (D) Power spectra with SEs of the data shown in (A) to (C), following the same color scheme.
