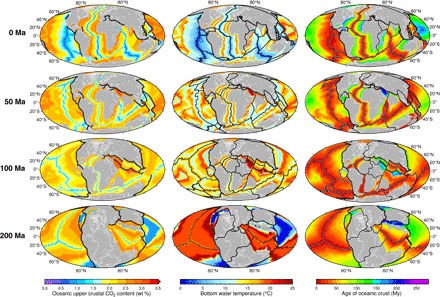
Fig. 4. Global model grids.

Modeled oceanic crustal CO2 content through time (left), bottom water temperature at the time of crustal accretion for any given parcel of ocean crust through time (middle), and paleo-age of the ocean crust (right) (19). Note that the increased crustal CO2 content at 50 and 100 Ma, relative to today, is driven mainly by increased ocean bottom water temperatures during crustal formation. Crustal CO2 content decreases from 100 to 200 Ma because of the presence of large areas of crust formed during the Late Carboniferous–Early Permian ice age associated with cool ocean bottom water temperatures (Fig. 3B) in the Panthalassic Ocean.
