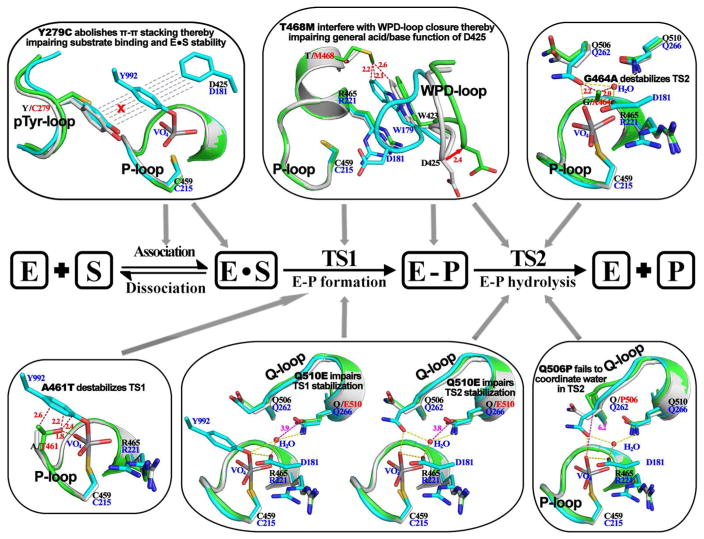
Figure 8.
LS SHP2 mutations reduce SHP2 phosphatase activity by disturbing different step(s) in the catalytic process. In this figure, SHP2 wild-type (gray) and mutant (green) were superimposed onto PTP1B (cyan) structure representing transition state 1 or 2 to show mutation-induced disturbance at each specific step. Residue numbers are shown in blue for PTP1B and black for SHP2. Red dash lines represent mutation induced steric conflicts.

