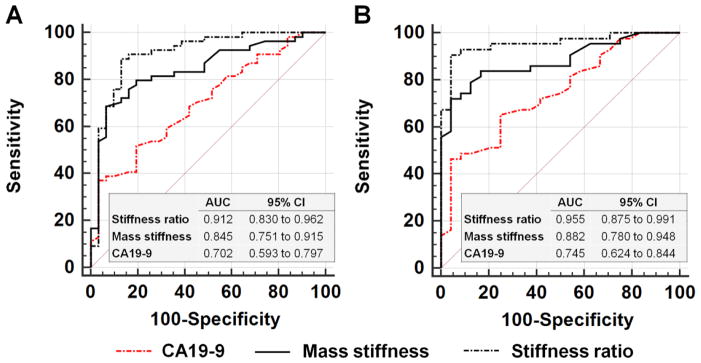
Figure 6.
Composite graph comparing the receiver operating characteristic (ROC) curves for serum CA19-9 levels, mass stiffness, and stiffness ratio (mass stiffness/parenchymal stiffness). a. Differentiation of malignant from benign pancreatic masses and b. differentiation of pancreatic adenocarcinoma from mass-forming pancreatitis. The numbers in the tables indicate area under the ROC curve (AUC) values and 95% CIs. All of the pairwise comparisons of the AUCs in a and b were significant, as follows. a: CA19-9 vs mass stiffness, P=0.048; CA19-9 vs stiffness ratio, P<0.001; stiffness ratio vs mass stiffness, P=0.026. b: CA19-9 vs mass stiffness, P=0.038; CA19-9 vs stiffness ratio, P=0.003; stiffness ratio vs mass stiffness, P=0.026.

