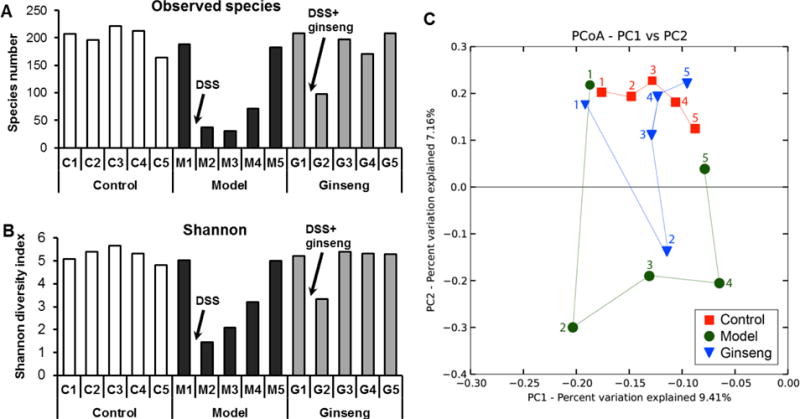
Fig. 6.

Microbial structural comparison of fecal microbiota. (A) Species richness of fecal microbiota in different groups. In model group, after DSS treatment, the number of species was reduced obviously. American ginseng treatment attenuated the influence of DSS treatment. (B) Shannon diversity index of fecal microbiota in different groups. Similar to the species richness results, American ginseng treatment restored the negative influence by DSS. (C) Principal coordinate analysis (PCoA) scores plot. Each point represents the principal component score of all rats in a group at a certain time point. The abbreviations of group names are as follows: C: control; M: model; G: ginseng treatment.
