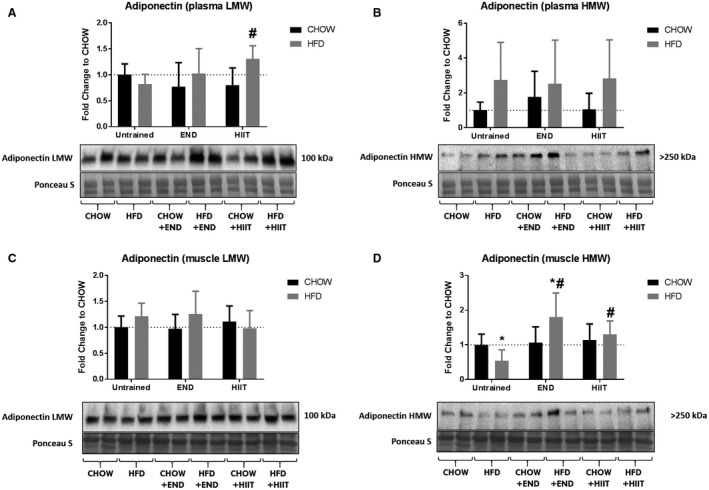
Figure 7.

Adiponectin isoforms in plasma and muscle. Plasma low‐molecular weight (LMW) adiponectin (A) and high‐molecular weight (HMW) adiponectin (B); muscle LMW (C) and HMW (D), and their representative blots below its respective graph. Data are presented as means ± SD and the number of animals in each group is 8. *P < 0.05 versus CHOW untrained; #P < 0.05 versus HFD untrained by two‐way ANOVA with Dunnet's and Sidak's post‐hoc tests.
