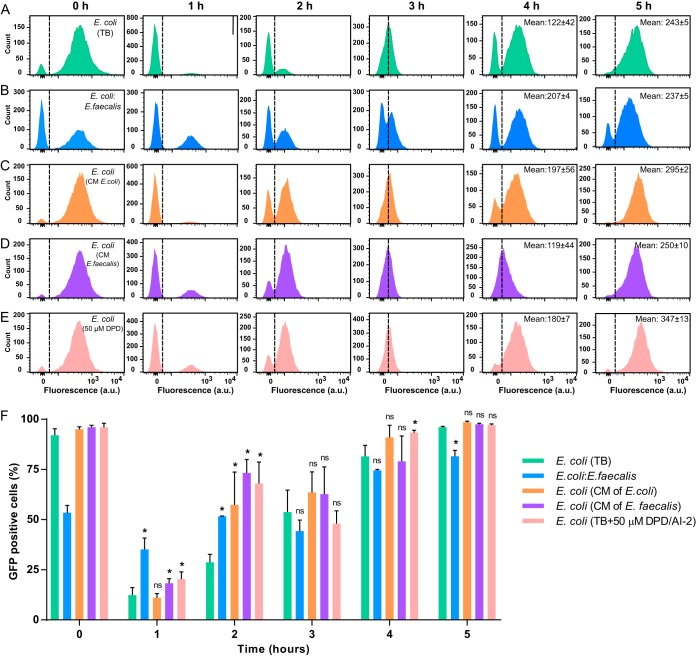
FIG 5.
Dependence of Plsr-egfp activity on growth stage and AI-2 signaling. The activity of the lsr operon was measured using flow cytometry. (A to E) E. coli cells carrying the Plsr-egfp reporter plasmid pVS1723 grown in TB alone (A) or with E. faecalis at a 1:1 ratio (B), grown in conditioned medium (CM) from E. coli (C) or E. faecalis (D), or grown in TB supplemented with 50 μM synthetic DPD/AI-2 (E). Dashed lines distinguish GFP-positive (induced E. coli) and GFP-negative (uninduced E. coli, as well as unlabeled E. faecalis in panel B) subpopulations. Note that, since E. coli constitutes only 50% of the population at 0 h in panel B, the overall fraction of GFP-positive bacteria appears lower than for E. coli monocultures. (F) Percentage of GFP-positive cells in each population. Means of four independent replicates are shown; error bars indicate standard deviations. P values for the difference from E. coli biofilms grown in TB were calculated using Mann-Whitney tests. *, P < 0.05; ns, not significant.

