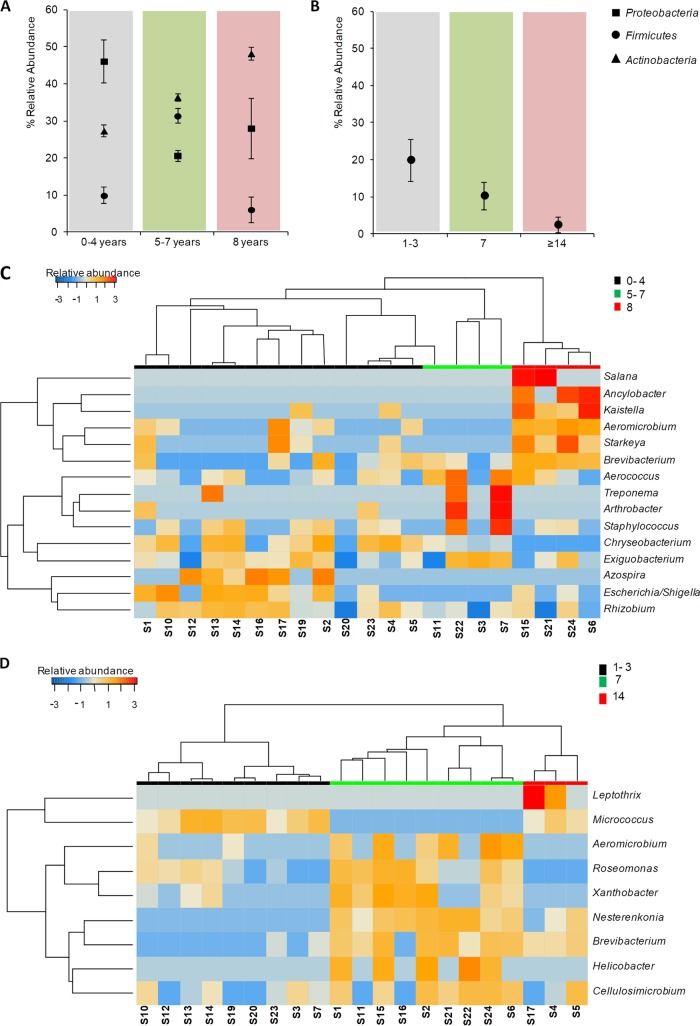
FIG 5.
Impact of age and frequency of use of DWs on the relative abundance of bacterial taxa present in the samples. (A and B) Mean ± standard error of the mean (SEM) of percent abundance in samples grouped by years of use (A) and frequency of use (B) at the phylum level. (C and D) Heatmap of significant bacterial genera in DW samples grouped by years of use (0 to 4, 5 to 7, and 8 years) (C) and frequency of use (1 to 3, 7, and ≥14 times/week) (D), respectively.

