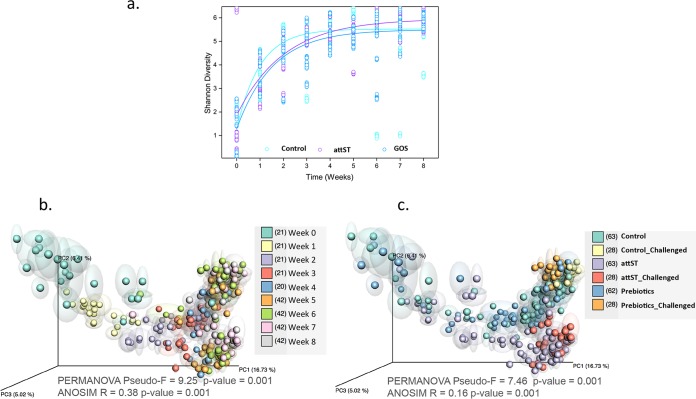
FIG 3.
(a) Shannon diversity index of samples by time (weeks) and treatment, including all time points. (b and c) Unweighted UniFrac principal-coordinate analysis (PCoA) plot of chicken cecal samples colored by time (b) and treatment (c). PERMANOVA and ANOSIM statistics for each category are indicated. The numbers between brackets in the legends indicate the numbers of samples included in the analyses.

