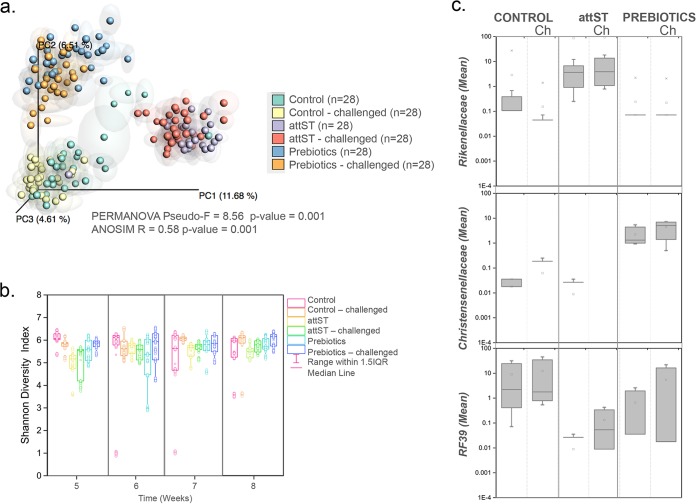
FIG 7.
Effect of treatment on composition and diversity of the cecum microbiome. (Top left) PCoA analysis of samples with repeated resampling, colored according to treatment. Only time points from week 5 and later were included in this analysis. PERMANOVA and ANOSIM statistics are indicated in the figure. (Bottom left) Shannon diversity indices of samples by treatment starting at week 5. (Right) Highly discriminant bacterial taxa determined by random forest analysis differentially represented in the different treatments (Kruskal-Wallis test, Bonferroni's correction, P < 0.05).

