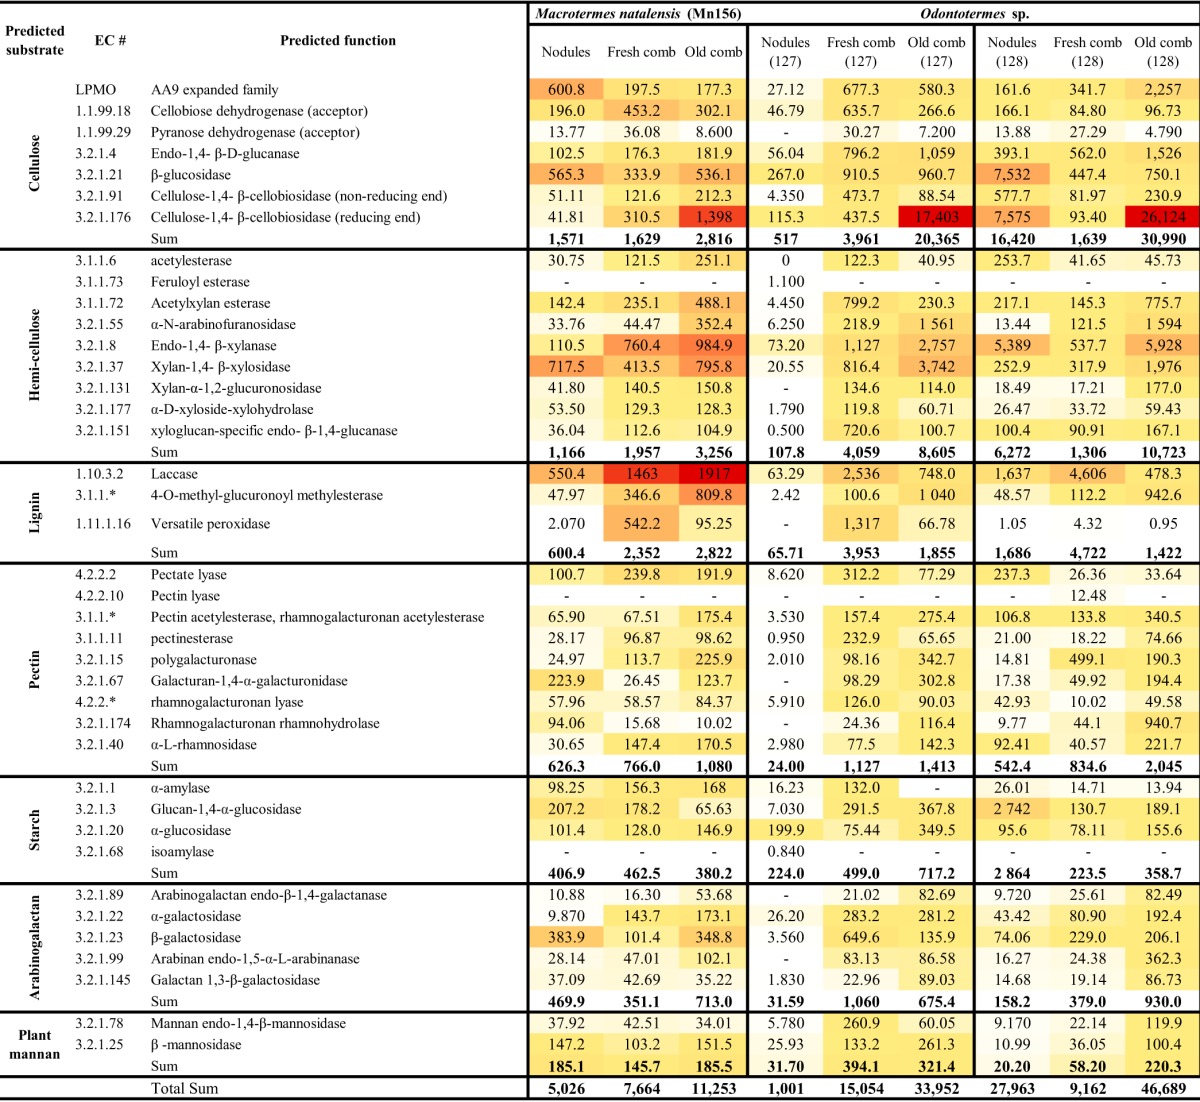
TABLE 3.
Expression levels of CAZymes across different sites of the decomposition process in one colony of Macrotermes natalensis and two Odontotermes sp. coloniesa

For the full results, see Tables S6 and S7. Nod., fungal nodules; F.C., fresh comb; O.C., old comb. White shading represents the lowest number of transcripts, yellow represents an intermediate number of transcripts, and red represents the highest number of transcripts.
