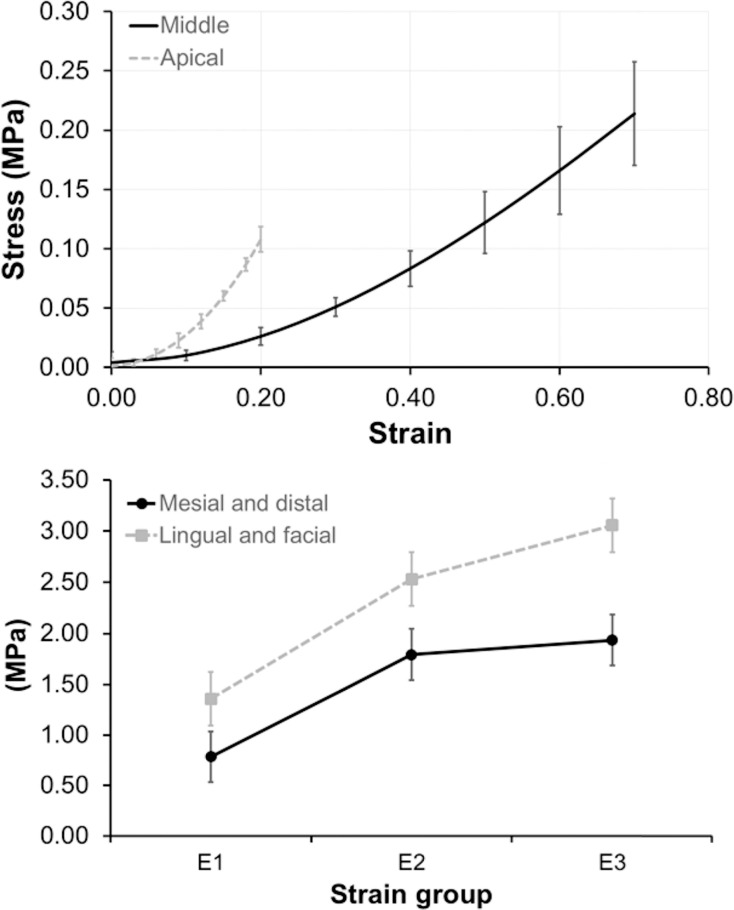
Figure 5.
(Top) Apical PDL group (dotted line) had a greater stiffness than did the middle group (solid line). (Bottom) Modulus change is greater at lower strain range (between E1 and E2), than at higher strain range (between E2 and E3). Lingual and facial surfaces (dotted line) were stiffer than mesial and distal surfaces (solid line).

