Fig. 7.

Biodistribution of PEG-CoFe2O4 nanoparticles in the blood, heart, liver, spleen, lungs, and kidney after different intervals (1, 6, 16, and 24 h) of exposure to mice. The error bars in the obtained data are shown in the figure

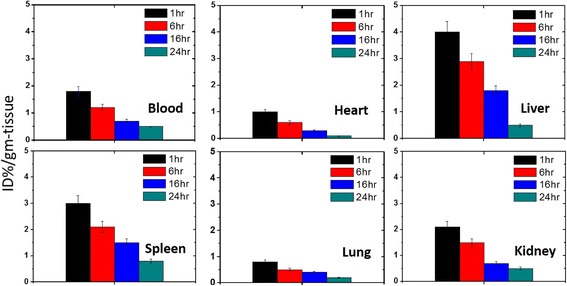
Biodistribution of PEG-CoFe2O4 nanoparticles in the blood, heart, liver, spleen, lungs, and kidney after different intervals (1, 6, 16, and 24 h) of exposure to mice. The error bars in the obtained data are shown in the figure